Download

1 / 35
350 likes | 482 Vues
AMOs 101 Understanding Annual Measurable Objectives. Office of Educational Accountability Wisconsin Department of Public Instruction November 2012. AMO Background. Background.

E N D
AMOs 101Understanding Annual Measurable Objectives Office of Educational Accountability Wisconsin Department of Public Instruction November 2012
Background Under NCLB, schools were required to meet AMOs in reading, math, and graduation. The AMOs in reading and math were tied to the goal of 100% proficiency in both content areas by 2013-14. This goal was widely panned as unrealistic and was the main driver for ESEA reauthorization conversations, which, when stalled in Congress, led to the waiver process. To receive a waiver, the US Department of Education (USED) requires states to establish ambitious but achievable AMOs in reading and mathematics proficiency and in graduation rates, and to publicly report performance on the AMOs.
Background • The old AMOs increased over time, but did not necessarily increase each year. • The same AMOs applied to all districts, schools, and student groups in the Wisconsin public school system. • The goal of NCLB was that all students would be proficient in Reading and Mathematics by 2013-14.
New AMOs AMOs are still part of Wisconsin’s accountability system, but they are not used to calculate the accountability scores that determine ratings and support. Starting with the 2011-12 school report card, AMO data is reported publicly but not factored into the accountability index. AMO data for all subgroups are presented on the last page of the School Report Card.
Establishing New AMOs • In our waiver request, we submitted ambitious but achievable AMOs based on proficiency rates resulting from Wisconsin’s new WKCE performance level cut scores. • Using 2011-12 data, AMOs were set to move all schools in the state to the level of the schools that are now performing at the 90th percentile within six years. • By 2016-17, the expectation is for all schools to have all student groups reach 50% reading proficiency and 65% mathematics proficiency. • Some subgroups have steeper AMO trajectories because they are further behind in proficiency rates. • A minimum 1% of growth is expected annually. This would apply to those schools/subgroups that are already meeting the AMOs but for whom we expect continued growth.
Meeting AMOs For a school’s reading and mathematics AMOs, a group’s performance compared to its AMO is measured by the higher of (1) the proficiency rate in the current year; or (2) the average proficiency rate in the current and prior year. A cell size of 20 is used and a 95 percent confidence interval is applied to determine whether or not an AMO is met.
A confidence interval (CI) is a type of estimate used to indicate the reliability of a statistic. • The CI gives an estimated range of scores (interval) within which the school’s or group’s “true score” falls. • The level of confidence of the CI indicates the probability that the confidence range captures this true population parameter given a distribution of samples. It does not describe any single sample. • The confidence interval gives us 95% certainty of the group’s performance. If the performance is within the confidence interval, it is determined to have met the AMO. We are 95% confident that the true value is in our confidence interval. Confidence Intervals
Graduation AMO • Schools also have an AMO for graduation rate. Wisconsin uses the graduation rate goal of 85 percent. A cell size of 20 and a 95 percent confidence interval are used to determine whether an AMO was met. • Separate graduation rate improvement targets are used for the four- and six-year rates. A school meets the graduation rate AMO for graduation if: • (1) the graduation rate for the most recent year, or for the most recent two years combined, meets the 85 percent goal; or • (2) the improvement in graduation rate meets the applicable target. DPI will first evaluate whether a school met the goal or target for the four-year rate. If it does not, the school will be evaluated using the six-year rate. • In 2011-12 only, the first year of this accountability system, a five-year rate was used in place of the six-year rate because we do not have the data to run a six-year rate until 2012-13.
Subgroup AMOs The AMOs expect an increase of 1% or more in proficiency rates annually. This assures that the top-performing subgroups continue to make progress. The six-year targets of 49.9% proficiency in reading and 65.3% proficiency in mathematics reflect dramatic increases in performance for most subgroups. Dramatic increases in performance will require dramatic effort.
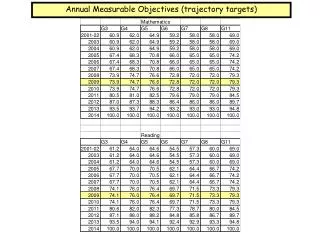
A Look at the New AMOs • With the new cut scores, 2011-12 statewide reading proficiency is 35.8% and mathematics proficiency is 48.1%. • The AMOs set forth in the waiver for “All Students” in 2011-12 show that statewide we are missing both AMOs. • 37.9% is the Reading AMO for 2011-12 • 49.8% is the Math AMO for 2011-12
AMO Analysis Half of all schools met all AMOs
AMO Analysis Non-Title I Title I Nearly half of the schools that met all the AMOs are Title I schools Of those, the majority are targeted assistance schools.
AMO Analysis Of the schools that are NOT meeting AMOs, six in ten are Title I schools. Of those, the majority are SWP schools.
AMO Analysis Of the Title I schools that are NOT meeting AMOs, three quarters are “other T1” – they are neither Focus nor Priority Schools.
AMO Analysis On average, there is a ten point difference in index scores between those schools that met AMOs and those that didn’t.
AMO Analysis # of deductions Schools that did not meet their AMOs were also more likely to receive deductions for Student Engagement.
AMO Analysis Another 25 of these schools are also Focus Schools Schools that did not meet their AMOs were also more likely to receive deductions for Student Engagement.
Data Analysis • Let’s examine AMO misses by content area • Reading • Math • Graduation • Let’s examine AMO misses by school type • Elementary • Middle • High School • Cross-reference with Focus/Priority status to zero in on area of need and intervention. • Examine where schools made it by confidence interval only
Using AMO Data Since all schools received a school report card, all schools can readily gauge their progress with their students and specific student groups. Schools can pinpoint how much progress their students and each student group will need to make annually, potentially establishing improvement plans with 2016-17 as a focal point. For those Title I schools that were identified as Title I Priority or Title I Focus schools, AMOs will be used as part of the exit criteria from those identifications (a four-year cohort). As such, these schools will want to pay particular attention to the progress of student groups each year of the cohort.
Using AMO Data Common Core instruction Multi-level systems of support (RTI/PBIS) to ensure we’re reaching all students Consider links to Indistar, SIR, school improvement planning that incorporates AMO data and/or action plans
AMO Worksheet • Schools can calculate the improvement needed to reach the AMOs required for each subgroup based on this year’s School Report Card data. • (subtract 2011-12 performance from 2016-17 AMO and divide by 5) • For example, in order to meet statewide all students • 35.8% reading in 2011-12 means 2.82% increase in percent proficient annually • 48.1% math in 2011-12 means 3.4% increase in percent proficient annually
Office of Educational Accountability Department of Public Instruction http://oea.dpi.wi.gov/