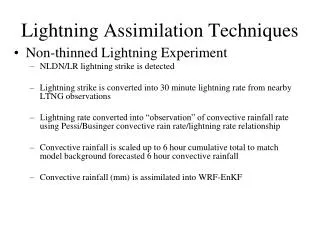
Lightning!
Lightning!. Memphis AMS/NWA Chapter meeting March 23, 2010. Overview. History of electrification Charge development and lightning formation Measurement tools National Lightning Detection Network Lightning Mapping Arrays Satellite Current research Severe weather

Lightning!
E N D
Presentation Transcript
Lightning! Memphis AMS/NWA Chapter meeting March 23, 2010
Overview • History of electrification • Charge development and lightning formation • Measurement tools • National Lightning Detection Network • Lightning Mapping Arrays • Satellite • Current research • Severe weather • Lightning warnings/cessation
Lightning: A brief history • Benjamin Franklin performed the first study of lightning in September 1751. • Kite experiment May 10, 1752 • This experiment was successfully repeated in 1752 by French scientist Thomas Francois D'Alibard • In July 1753 Swedish scientist G. W. Richmann was killed when trying to recreate the Franklin experiment. • Little was done between the late 1700s until the early 1900s Image adapted from MacGorman and Rust (1998) The Electrical Nature of Storms
Lightning: a brief history • C.T.R. Wilson was the first to use electric field measurements to estimate the structure of thunderstorm charges involved in lightning discharges. • Wilson formulated the hypothesis that a thunderstorm consisted of a dipole • Wilson also won the Nobel Peace Prize for the creation of his cloud chamber • Lightning research took off in the early 1960s with the development of the space program Image adapted from www.nobelprize.org
Charge Development • The non-inductive charging mechanism primarily responsible for thunderstorm charging. • Temperature difference causes charge difference • Collisions cause charge separation • Sign of charge transferred depends on: • temperature • effective liquid water contents • rime accretion rate • relative velocity between particles Combination of results from Takahashi (1978) and Saunders et al. (1991) Figure above adapted from Saunders (1993)
Lightning Formation • 3/6+ Step process • Corona • Stepped Leader • 50 m jumps, tip of leader is corona point • Cloud to Ground also includes • Upward Leader • Junction process • Return stroke • dart leader • dart stepped leader VIDEO(S) • http://www.ztresearch.com/ Interferometer measurement of in cloud lightning. Adapted from Shao and Krehbiel (1996)
National Lightning Detection Network • First developed in the early 1980s • Originally used TOA system (LPATS) • Direction finder network created by early 1990s • 2 antennas • Companies merged, and merged systems, and now this is owned by Vaisala, Inc. • New sensor is a combination of both • IMPACT sensor (left) Images courtesy www.nasa.gov
3-D Lightning Mapping Above – The Northern Alabama 3-D VHF Lightning Mapping Array VHF antenna locations (green dots). Image provided by the NASA SPoRT (Short-term Prediction Research and Transition Center) website. (http://www.ghcc.msfc.nasa.gov/sport/) Adapted from Thomas et al. (2004) depicting a lightning flash in space and time. Cool colors represent the early parts of the flash, while warmer colors indicate flash propagation in the latter part of the flashes history Lightning mapping arrays measure the electrical breakdown process using VHF sources in 80 μs intervals to detect lightning in three dimensions Operates using TV channel 5 (76-82 MHz) Accuracy out to 150 km, <50 m
LMA Flash examples March 30 2002, 0809 UTC March 30 2002, 0819 UTC Movies taken from: http://branch.nsstc.nasa.gov/public/LMA/archive/imagery/
Precursors to the Satellite Era Video taken from the space shuttle over Argentina. Courtesy Dr. William Koshak, MSFC U2 observation of a thunderstorm over Georgia, in June 1983. Vonnegut et al. (1989)
Satellite Observations • Lightning can be observed from space • Two satellites have been used to observe lightning • Tropical Rainfall Measuring Mission • Optical Transient Detector • Uses a thin oxygen line to observe lightning flashes • Future real time observations of total lightning will be on the GOES-R satellite Tropical Rainfall Measuring Mission Satellite Total lightning observed by TRMM (Images courtesy www.nasa.gov)
2144 UAH/NSSTC THOR Center and Hazardous Weather Testbed 2144 MAX ? KHTX MIPS/NSSTC 68 km ARMOR RSA 75 KGWX ARMOR DD lobe 1 km Res. 1.5 km Res. LMA 100-500 m MAX MIPS Profiler LMAAntenna NEXRAD KBMX Part 3: Current Research
Correlating Lightningto Severe Weather • Goodman et al. 1988 demonstrated that total lightning peaked prior to the onset of a microburst • Williams et al. 1989 showed that the peak total flash rate correlated with the maximum vertical extent of pulse thunderstorms, and preceded maximum outflow velocity by several minutes Adapted from Goodman et al. (1988) Adapted from Williams et al. (1989)
Previous Work • Williams et al. (1999) once again illustrates the usefulness of total lightning data in determination of storm severity in Florida thunderstorms. • Williams also proposed 60 flashes min-1 or greater for separation between severe and non-severe thunderstorms. Adapted from Williams et al. (1999)
Overall Goals – Lightning Jump Algorithm • Build on the lightning jump framework set through previous studies. • Understand what typically occurs in non-severe convection with respect to increases in lightning. • Ultimately develop a lightning jump algorithm for use on the Geostationary Lightning Mapper (GLM) • Also for NWS offices with ground based lightning mapping networks available. Adapted from Williams et al. (1999)
Severe Weather Examples April 4, 2007, 0245-0345 UTC September 25, 2005 1800-2030 UTC
LMA Source Data 15 -17Z 19 June 2007 Null Examples/False Alarms June 14, 2005
Lightning Jump Algorithm Update • 367 thunderstorms analyzed so far from 3 different regions of the country • 111 severe, 256 non severe • Best skill from the 2 sigma configuration • NWS skill scores for all severe weather (80-90% POD; FAR ~48%) • Average Peak flash rate of non severe thunderstorms about 10 flashes per minute • Next steps: • Look at other regions of the country • Examine warning summaries from NWS to compare to jump signatures • Explore combinations of algorithms to see if there is any improvement in the skill scores
Lightning Warning Products D. Buechler, NASA, MSFC/UAHuntsville
Polarimetric Radar Zh, kh Variables…….. • Reflectivity factor Z at horizontal (Zh) or vertical (Zv) polarization [Conventional radar measure] • - Measure of drop size andconcentration; • Most sensitive to drop SIZE (D6) • 2. Differential reflectivity ZDR a ratio of returned power: (Zh/Zv) • - Measure of median drop diameter→SIZE/SHAPE • - Useful for rain / hail / snow discrimination→SIZE/SHAPE • 3. Propagation differential phase, FDP, and from it, • specific propagation differential phase KDPS(kh – kv) • - Measure of water content and drop size→NUMBER/SHAPE • - Immune to radar calibration, attenuation, partial beam blockage • 4. Correlation coefficient ρhv • - Indicator of mixed precipitation → SHAPE/PHASE/CANTING (Depolarization) • - Useful for identifying non-meteorological scatterers too! We need the measurement in H and V directions! Zv, kv • Advantages: Better description of various particle types/shapes in a given volume • Determine size distribution- more accurate rain rates (improved QPE) • Hydrometeor ID and non-meteorological scatterers (clutter!) • Consistent calibration Walter A. Petersen NASA MSFC VP-61
Background Past research has shown strong evidence for ice crystal orientation signatures in polarimetric radar[differential phase] observations of thunderstorms (e.g., Hendry and McCormick 1976, 1979; Hendry and Antar 1982; Krehbiel et al. 1991, 1992, 1996; Metcalf, 1992, 1995; Caylor and Chandrasekar 1996; Galloway et al. 1997; Scott et al. 2001; Marshall et al. 2009). Theoretical work by Weinheimer and Few (1987) demonstrated that ice crystals up to 1-2 mm could be vertically aligned by strong vertical electric fields (E-fields) of about 100-200 kV m-1. Strong motivation for our ongoing work is provided by Krehbiel et al. (1993): “[polarimetric radar] signatures have been found to provide an excellent indicator of the potential for lightning in a storm and we have used them to predict the occurrence of numerous lightning discharges. The [polarimetric] measurements have also been used to detect the initial electrification of storms and to determine when a storm is finished producing lightning.” Radar differential phase (specific differential phase, Kdp, and its integral dp or PHIDP) is currently measured by many research (e.g., UAH-NASA ARMOR C-band, UAH MAX X-band) and operational (e.g., new 45WS CCAFS-KSC Radtec TDR 43‑250 C-band) radars. L. D. Carey, ESSC, ST2009
Time 1632 UTC 1630 UTC fDP Z fDP Z 6.2 km 6.2 km Height fDP Z fDP Z 7.2 km 7.2 km Sector scans: Examine time and height changes in ice orientation (change of fDP with range-red circle) in a lightning-producing cloud. [UAH X-band dual-pol data from August 18, 2009]. Before flash After flash
Useful Links • http://www.nsstc.uah.edu/atmos/ • http://www.nsstc.uah.edu/ARMOR/webimage/ • http://weather.msfc.nasa.gov/sport/lma/ • http://thunder.msfc.nasa.gov/ • http://www.srh.noaa.gov/mlb/?n=total_lightning • http://www.srh.noaa.gov/srh/jetstream/