Contour lines
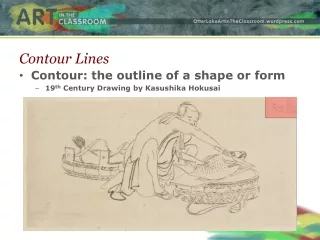
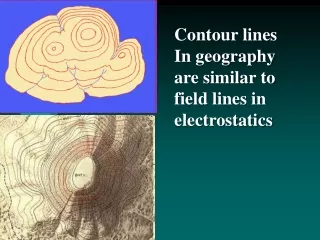
Contour lines. Contour lines: curved lines drawn on the map, connecting points having the same elevation. Contour interval: is the vertical distance between successive contour lines Example: 0.5m, 1m, 2m, 5m, 10m, 20m, 50m

Contour lines
E N D
Presentation Transcript
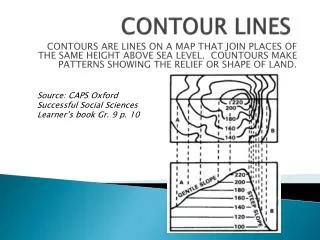
Contour lines: curved lines drawn on the map, connecting points having the same elevation
Contour interval: is the vertical distance between successive contour lines • Example: 0.5m, 1m, 2m, 5m, 10m, 20m, 50m • Contour interval should not be changed over the same map (constant over the same map) • interval=5m 15 10 5
Factors that decide the contour interval • 1- the area topography: flat area… small interval • 2- the scale of the map: • Small scale maps……..large intervals • 3- purpose of the map • Engineering construction over small site……small contour interval
Characteristics of the contour lines • 1- continuous closed curved lines • 2- cannot meet or cross any other contour lines • 3- cannot split or join any other lines except in the case of a cliff
4- close to each other at steep slopes • 5- wide spacing between contour lines at flat slopes
6- uniformly spaced contours indicates uniform slope • 7-contour lines at a river valley take a V shape pointing to the river source (upstream) upstream
Methods of contour line measurements and plot • 1- grid method: divide the area into equal size squares (grid) and measure the elevations at each corner • 2-Spot height method: measure the elevations and coordinates of points(not regularly spaced) that best represent the shape of earth surface • 3-Cross section method: use the data of the profile and cross section to plot the contour lines
Grid method • Example data for simple grid • x, y, elevation data for 50x50m grid • 0,0,60 • 0,100,55 • 100,100,58 • 100,0,75 • 50,50,80
new data • 0,0,60 • 0,100,55 • 100,100,58 • 100,0,75 • 80,50,120 • 100,50,60