Download
1 / 17
170 likes | 311 Vues
Global High Resolution Analyses and Forecasts at the Mesoscale. H. Hurlburt 1 , Y. Drillet 2 , G. Brassington 3 , M. Benkiran 4 , E. Chassignet 5 , J. Cummings 6 , M. Drevillon 7 , H. Etienne 4 , O. Le Galloudec 2 , E.J. Metzger 1 , P. Oke 8 , T. Pugh 3 ,

E N D
Global High Resolution Analyses and Forecasts at the Mesoscale H. Hurlburt1, Y. Drillet2, G. Brassington3, M. Benkiran4, E. Chassignet5, J. Cummings6, M. Drevillon7, H. Etienne4, O. Le Galloudec2, E.J. Metzger1, P. Oke8, T. Pugh3, A. Schiller8, J.F. Shriver1, O.M. Smedstad9, B. Tranchant7, A. Wallcraft1, G. Warren10 1Naval Research Laboratory, Stennis Space Center, MS, USA 2Mercator-Océan, Ramonville Saint Agne, France 3Centre for Australian Weather and Climate Research, BoM, Melbourne, Australia 4CLS, Ramonville Saint Agne, France 5Florida State University, COAPS, Tallahassee, FL, USA 6Naval Research Laboratory, Monterey, CA, USA 7CERFACS, Toulouse, France 8Center for Australian Weather and Climate Research, CSIRO, Hobart, Australia 9Planning Systems Inc., Stennis Space Center, MS, USA 10Bureau of Meteorology, Melbourne, Australia GODAE Final Symposium, 12 – 15 November 2008, Nice, France
2004-2006 Sea Surface Height (SSH) Variability From satellite altimetry (CLS) From a 1/12 Mercator Océan simulation without data assimilation (using the NEMO model) (in m2)
SSH Variability in the Gulf Stream Region 45N 4 years from 1/12 global HYCOM with climatological forcing and no data assimilation 40N 35N 30N 45N Along altimeter tracks in 4 orbits spanning 2000-2007. From Hurlburt and Hogan (2008, DAO) courtesy Gregg Jacobs (NRL). 40N 35N 30N 80W 70W 60W 50W 40W
MODIS Ocean Color vs 10-day Gulf Stream Region Current Speed Forecasts from 3 Mercator-Océan Systems on 23 April 2008 MODIS 1/12 Atlantic 1/12 global 1/4 global All the Mercator Océan systems use the NEMO model and SEEK data assimilation
East Australian Current System on 8 March 2007 1/10 Operational BLUElink Nowcast 1/10 BRAN 2.2 Reanalysis ± 2-day drifter trajectories overlaid on sea level anomalies and ocean currents Both are global with 1/10 resolution in the Australian region (90E-180E, 75S-16N) and use MOM4 with multivariate EnOI data assimilation
1/10 Operational BLUElink Nowcast 15 Feb 2007 – 30 Apr 2007 GODAE Final Symposium, 12 – 15 November 2008, Nice, France
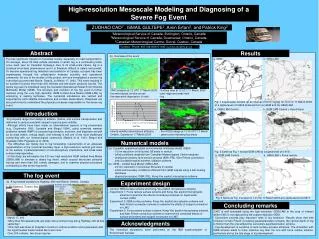
Eddies in Ocean Model Nowcasts vs SeaWiFS Ocean Color in the Northwestern Arabian Sea and Gulf of Oman on 6 Oct. 2002 Adapted from Hurlburt et al. (2008; AGU Monograph 177)
Eddies in Ocean Model Nowcasts vs SeaWiFS Ocean Color in the Northwestern Arabian Sea and Gulf of Oman on 6 Oct. 2002 Adapted from Hurlburt et al. (2008; AGU Monograph 177)
Eddies in Ocean Model Nowcasts vs SeaWiFS Ocean Color in the Northwestern Arabian Sea and Gulf of Oman on 6 Oct. 2002 Adapted from Hurlburt et al. (2008; AGU Monograph 177)
1/32 NLOM Nowcast SSH and Currents with Altimeter Tracks Overlaid 26°N 26°N 24°N 24°N 22 Sept 2002 29 Sept 2002 6 Oct 2002 22°N 22°N 20°N 20°N 18°N 18°N 16°N 16°N 56°E 58°E 60°E 62°E 56°E 56°E 58°E 60°E 62°E 58°E 60°E 62°E Adapted from Hurlburt et al. (2008; AGU Monograph 177) (in cm) • Altimeter track data from ERS-2 (red), GFO (black), and JASON-1 (white) were assimilated daily using a 3-day data window and the model as a first guess • Altimeter tracks are overlaid with the most recent seven days as solid lines • Daily MODAS SST analyses are also assimilated • Atmospheric wind and thermal forcing is from FNMOC/NOGAPS
1/12 Global HYCOM forecasts vs. Verifying Analyses 1.0 1.0 Gulf Stream NW Arabian Sea and Gulf of Oman World Ocean 0.9 0.8 0.7 Median SSH anomaly correlation 1.0 Equatorial Pacific Kuroshio Yellow and Bohai Seas north of 30N 0.9 0.8 0.7 0.6 10 20 10 20 30 10 20 30 0 30 Forecast length (days) Atmospheric analysis forcing operational forcing*persistence 20 Forecasts included in statistics * Reverts toward climatology at end of atmospheric forecast. Partly from Hurlburt et al. (2008; AGU Monograph 177)
Verification of 30-day Forecasts of SSH vs Unassimilated Tide Gauge Data Open Ocean Islands Coastal Both 1/12 HYCOM, with operational forcing 1/12 HYCOM, with analysis quality forcing 1/32 NLOM 1/16 NLOM A 13-day moving average was applied to filter time scales not resolved by the altimeter data Adapted from Hurlburt et al. (2008; AGU Monograph 177)
Mercator Océan Atlantic SST Forecast Error vs SST Analysis C 1-day RMS Error 7-day RMS Error 0 .5 1.0 persistence RMS Error (C) forecast Length of Forecast (days)
Strong Coastal Upwelling Event off Southern Australia Observed SST MODIS ocean color 30 Mar 08 BLUElink SST 10 Feb 2008 10 Feb 2008 Organisations 15 Jan – 15 Feb mean winds Bonney coast off South Australia is a location of frequent coastal upwelling The upwelling in Feb 2008 was one of the largest events ever recorded Australia
BLUElink Prediction of Coastal Trapped Wave Events around Australia Organisations Sea Level Anomaly • South Australia non tidal sea level exceeded 0.6m, 29th October 2007 • Tasmania, Derwent River, non tidal signal ~0.4m, 9th August 2007 • Hobart Mercury, 10th August 2007 “WILD weather and huge downpours continue to flood three major valleys in Tasmania, triggering car crashes, fires and a dangerous landslide.”
BLUElink Coastal Trapped Wave Nowcast Accuracy at the Thevenard, Australia Coastal Tide Gauge Organisations Non-tide residual (m) South Australia, Thevenard coastal tide gauge Comparison of OceanMAPs () and non tidal sea level CTG () Thevenard
BLUElink Coastal Trapped Wave Forecast Accuracy around Australia RMSE (m) Forecast period (days)