Impact of Badger Removal on Bovine Tuberculosis Levels in East Offaly (1989-1994)
170 likes | 297 Vues
This project analyzed the effects of extensive badger removal on bovine tuberculosis (TB) levels in cattle in East Offaly from 1989 to 1994. Our primary objective was to capture and remove as many badgers as possible while monitoring changes in TB incidents in local cattle herds. The results showed significant differences in reactor levels and positive contiguous herds between the removal and control areas, indicating the efficacy of badger culling in managing TB outbreaks in cattle. The study contributes valuable insights into wildlife management and agricultural health.

Impact of Badger Removal on Bovine Tuberculosis Levels in East Offaly (1989-1994)
E N D
Presentation Transcript
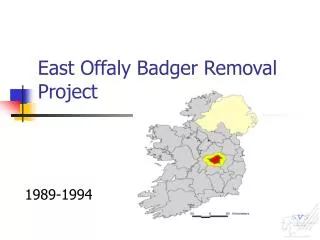
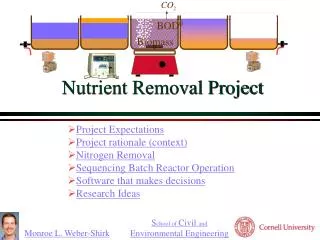
East Offaly Badger Removal Project 1989-1994
Area • Project • Buffer • Control
Objectives • Removal of as many badgers as possible. • Monitor the effect of this removal on TB levels in cattle. • Compare results with a control area & national figures.
Previous badger Removals. • Ballycrissane, Co Galway, 1985 • 7 sq km area • 54 badgers captured • 15 (29%) gross TB lesions
Sett Survey • Main Setts 234 • Other Setts 418 • 50% of main setts in hedgerow • 62% of other setts in hedgerow
Case control studyEves (2001) A case control study on the incidence of bovine TB in an area of extensive badger culling in Co Offaly, Ireland. M V M. thesis NUI. • 107 herds in the Project area. This was the total herds in the area with a confirmed TB outbreak in the years 1986,87 & 88. • 122 similar herds from the rest of Co Offaly in which intensive badger removal did not take place were selected at random.
Case control study (contd) • Herd size • Enterprise type • Cows per herd • Total reactors • Reactor cows • Reactor non-cows • Positive contiguous herds • Number of failed tests
Total Reactors (1990-1993) • 74 reactors in 30 of the Project Area herds. ( range 1 - 11) • 287 reactors in 57 of the Control Area herds. ( range 1- 34) • Difference statistically significant (P < 0.05)
Reactor non-cows • 36 reactor non-cows in Project Area. • 209 reactor non-cows in Control Area • Difference significantly different (P<0.05)
Positive Contiguous Herds • Project Area; 0.97 per herd • Control Area; 1.91 per herd • Difference statistically significant (P<0.01)
Number of failed tests • Project Area; 1.26 • Control Area; 2.03 • Difference statistically significant (P< 0.01)