A bstract
Rapid, On-site Identification of Oil Contaminated Soils Using Visible Near-Infrared Diffuse Reflectance Spectroscopy. Chakraborty, S. 1 , D. Weindorf 1 , H.M. Selim 1 , B. Li 2 , C.L.S. Morgan 3 , Y. Ge 3 , and J. Galbraith 4

A bstract
E N D
Presentation Transcript
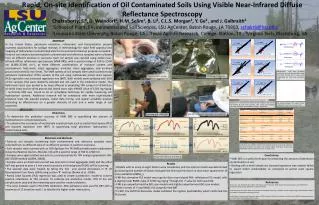
Rapid, On-site Identification of Oil Contaminated Soils Using Visible Near-Infrared Diffuse Reflectance Spectroscopy Chakraborty, S.1, D. Weindorf1, H.M. Selim1, B. Li2, C.L.S. Morgan3, Y. Ge3 , and J. Galbraith4 1School of Plant, Environmental and Soil Sciences, LSU AgCenter, Baton Rouge, LA 70803, schakr6@lsu.edu; 2Louisiana State University, Baton Rouge, LA ; 3Texas Agrilife Research, College Station, TX ; 4Virginia Tech, Blacksburg, VA Abstract In the United States, petroleum extraction, refinement, and transportation present countless opportunities for spillage mishaps. A methodology for rapid field appraisal and mapping of hydrocarbon contaminated soils for environmental cleanup purposes is needed. Forty-six soil samples (containing both contaminated and reference samples) were collected from six different parishes in Louisiana. Each soil sample was scanned using visible near- infrared diffuse reflectance spectroscopy (VNIR DRS), with a spectral range of 350 to 2,500 nm (4,000-25,000 cm-1), at three different combinations of moisture content and pretreatment: field-moist, intact aggregates; air-dried, intact aggregates; and air-dried ground and sieved (2 mm sieve). The VNIR spectra of soil samples were used to predict total petroleum hydrocarbon (TPH) content of the soil using multivariate partial least squares (PLS) regression and a boosted regression tree (BRT). Both models were validated with 30% of the samples that were randomly selected and not used in the calibration model. The field-moist intact scan proved to be more efficient in predicting TPH content (r2=0.64) than air-dried intact and air-dried ground and sieved scans with a RMSE value of 0.341 log mg kg-1. Summarily DRS was found to be an acceptable technique for rapidly measuring soil hydrocarbon content. Additional research will be conducted with more sophisticated analytical tools like wavelet analysis, cubist data mining, and spatial variability analysis evaluating its effectiveness on a greater diversity of soils and a wider range of soil properties. Field moist intact Predicted TPH (log mg kg-1) Air dry intact Air dry ground Predicted TPH (log mg kg-1) Wavelengths with their respective coefficients for first derivative PLS model of a) FMI b) ADI ,and c) ADG scans ,respectively for soils from Louisiana, USA. ADI-reflectance Contaminated sample Air drying of samples Predicted TPH (log mg kg-1) ADG-reflectance ADG-first derivative Lab measured log transformed TPH content (log mg kg-1) Prediction vs. measured TPH content of the validation data set for PLS models for soils from Louisiana, USA. Circles and triangles represent calibration and validation samples, respectively. No relation between TPH, organic matter and clay for soils from Louisiana, USA. • Objectives • To determine the prediction accuracy of VNIR DRS in quantifying the amount of hydrocarbons in contaminated soils. • To compare the accuracies of multivariate analytical tools such as partial least square (PLS) and boosted regression tree (BRT) in quantifying total petroleum hydrocarbon in contaminated soils. GIS-GPS linking for sampling site selection Scanning with VNIR DRS Raw scan Seamless spectra Smoothed spectra • Materials and Methods • Forty-six soil samples (containing both contaminated and reference samples) were collected from six different sites of six different parishes in southern Louisiana. • Soils samples were scanned with an ASD AgriSpec Pro FR VNIR portable spectroradiometer (Analytical Spectral Devices, Boulder, CO) with a spectral range of 350 to 2,500 nm. • Samples were again bottled and sent to a commercial lab for TPH analysis [gravimetric SW-846 5520B method (USEPA, 2000)]. • Samples were air dried and one half was scanned as intact aggregates (ADI) and the other half was ground to pass a 2 mm sieve to produce air-dried ground (ADG) soil for scanning. • The spectral data were treated by taking the first and second derivatives in ‘R’ (R Development Core Team, 2004) using custom ‘R’ routines (Brown et al., 2006). • Partial Least Squares (PLS) regression was used to create a prediction model to convert spectral reflectance to TPH content. To calibrate the prediction model, 70% of the soil samples were used and the remaining were used for model validation. • The same datasets used in PLS (70% calibration, 30% validation) were used for BRT with a maximum of 12 branches node-1, to identify the higher order interactions. First derivative Average spectra Second derivative Calibration and validation statistics for boosted regression tree using reflectance and first derivative for visible near-infrared diffuse reflectance spectroscopy (VNIR DRS) analysis models for soils in Louisiana, USA. • Conclusions • VNIR DRS is a useful technique for predicting the amount of petroleum contamination in soil. • Dealing with a small sample set, boosted regression tree analysis failed to report better predictability as compared to partial least square regression. Sequential spectral processing • Results • Models with as many as eight factors were considered, and the optimal model was determined by choosing the number of factors that gave the first local minimum in root mean square error of cross validation (RMSEcv). • FMI-first derivative PLS model was superior than more biased FMI- reflectance PLS model, with a slightly lower RMSE value of 0.343 log mg kg-1 though the r2 value for both was 0.64. • FMI scan outperformed the ADI scan models and slightly outperformed ADG scan models. • Both in terms of r2 and RMSE, PLS outperformed BRT. • In BRT, the FMI-first derivative model exhibited the highest predictability which confirmed the PLS trend. References Brown, D.J., K.D. Shepherd, M.G. Walsh, M.D. Mays, and T.G. Reinsch. 2006. Global soil characterization with VNIR diffuse reflectance spectroscopy. Geoderma. 132(3-4):273-290. R Development Core Team. 2004. The R project for statistical computing . Available at www.r-project.org (verified 26 Nov. 2006). R Foundation for Statistical Computing, Vienna. United States Environmental Protection Agency. 2000. Analytical Methods Guidelines for EPA method 1664A implementation and use (40 CFR part 136), USEPA office of water.