NOTE: Variable must be approximately normally distributed
ANATOMY OF A CONFIDENCE INTERVAL FOR m WHERE n < 30. When SIGMA, s , is KNOWN and n < 30. When SIGMA, s , is UNKNOWN and n < 30. NOTE: Variable must be normally distributed

NOTE: Variable must be approximately normally distributed
E N D
Presentation Transcript
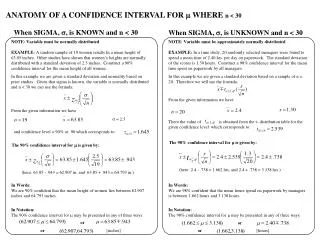
ANATOMY OF A CONFIDENCE INTERVAL FOR m WHERE n < 30 When SIGMA, s, is KNOWN and n < 30 When SIGMA, s, is UNKNOWN and n < 30 NOTE: Variable must be normally distributed EXAMPLE: A random sample of 19 women results In a mean height of 63.85 inches. Other studies have shown that women’s heights are normally distributed with a standard deviation of 2.5 inches. Construct a 90% confidence interval for the mean height of all women. NOTE: Variable must be approximately normally distributed EXAMPLE: In a time study, 20 randomly selected managers were found to spend a mean time of 2.40 hrs. per day on paperwork. The standard deviation of the scores is 1.30 hours. Construct a 98% confidence interval for the mean time spent on paperwork by all managers. In this example we are given a standard deviation and normality based on prior studies. Given that sigma is known, the variable is normally distributed and n < 30 we can use the formula: In this example we are given a standard deviation based on a sample of n = 20. Therefore we will use the formula: From the given information we have From the given information we have s = 2.5 There the value of is obtained from the t- distribution table for the given confidence level which corresponds to: and confidence level = 90% or .90 which corresponds to: The 98% confidence interval for m is given by: The 90% confidence interval for m is given by: (here: 2.4 - .738 = 1.662 hrs. and 2.4 + .738 = 3.138 hrs.) (here: 63.85 - .943 = 62.907 in. and 63.85 + .943 = 64.793 in.) In Words: We are 90% confident that the mean height of women lies between 62.907 inches and 64.793 inches. In Words: We are 98% confident that the mean hours spend on paperwork by managers is between 1.662 hours and 3.138 hours. In Notation: The 90% confidence interval for m may be presented in any of three ways: In Notation: The 98% confidence interval for m may be presented in any of three ways: or or or [inches] or [hours]