Download
1 / 1
10 likes | 131 Vues
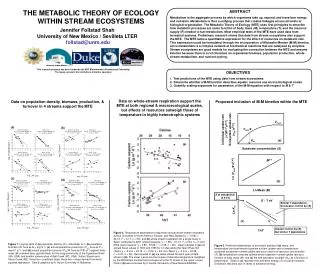
OBJECTIVES Test predictions of the MTE using data from stream ecosystems Determine whether a M-M function describes aquatic resource use across biological scales Quantify scaling exponents for parameters of the M-M equation with respect to M & T. (a). (b). (a). (c). (d). (b).

E N D
OBJECTIVES • Test predictions of the MTE using data from stream ecosystems • Determine whether a M-M function describes aquatic resource use across biological scales • Quantify scaling exponents for parameters of the M-M equation with respect to M & T (a) (b) (a) (c) (d) (b) E of metabolism (0.6 eV) E ~ ? eV Similar T dependence, but weaker control by [S] Ln Km (c) Greater control by [S], but similar T dependence 1/kT University of New Mexico This research proposal has been funded by the NSF Bioinformatics Postdoctoral Fellowship.The logos represent the institutions of mentor sponsors. Vmax M3/4 Individual uptake rate (v*M-3/4*eE/kT)Ecosystem uptake rate(vtot*eE/kT) Vmax/2 Ln (Vmax/2*eE/kT) Km (a) (b) Substrate concentration(S) Ln Mass (M) THE METABOLIC THEORY OF ECOLOGY WITHIN STREAM ECOSYSTEMS ABSTRACT Metabolism is the aggregate process by which organisms take up, expend, and transform energy and nutrients. Metabolism is thus a unifying process that creates linkages across all levels of biological organization. The Metabolic Theory of Ecology (MTE) uses first principles to describe how metabolic processes are some function of body mass (M), temperature (T), and the resource supply (R) needed to fuel metabolism. Most empirical tests of the MTE have used data from terrestrial systems. Preliminary research shows that data from stream ecosystems also support the MTE. The MTE lacks a quantitative expression for the effect of resources on metabolic rate. This expression could be formulated through the incorporation of Michaelis-Menten (M-M) kinetics, since metabolism is a complex network of biochemical reactions that are catalyzed by enzymes. Stream ecosystems are good models for evaluating the connection between the MTE and enzyme kinetics because there is a rich literature on organismal biomass, population production, whole-stream metabolism, and nutrient cycling. Jennifer Follstad Shah University of New Mexico / Sevilleta LTER follstad@unm.edu Data on whole-stream respiration support the MTE at both regional & macroecological scales, but effects of resources outweigh those of temperature in highly heterotrophic systems Data on population density, biomass, production, & turnover in 4 streams support the MTE Proposed inclusion of M-M kinetics within the MTE Figure 2. Temperature dependence of (a) mean annual whole-stream respiration across 15 studies in North America, Europe, and New Zealand (y = -0.60x + 24.10, r2 = 0.17, n = 53); and (b) whole-stream respiration for a single study in Spain conducted in 2001 (closed squares; y = 1.55x - 61.17, r2 = 0.94, n = 7) and 2002 (open squares; y = 0.89 - 35.92, r2 = 0.35, n = 26). Open triangles in (a) are annual mean values in 1994 and 1995 for 14 sites along the Taieri River, NZ (Taieri: y = -0.61x + 24.15, r2 = 0.09, n = 24; non-Taieri: y = -0.61x + 24.38, r2 = 0.21, n = 29). Red squares in (a) are mean values for each year of data shown in (b). The lower x-axes are the inverse of absolute temperature multiplied by the Boltzmann constant and correspond to the ºC shown in the upper x-axes. Data in (b) were provided by V. Acuña (University of New Mexico/EAWAG). Figure 1. Log-log plots of (a) population density (N = individuals m-2), (b) population biomass (W, here as B = mg m-2), (c) annual population production (Ptot, here as P = mg m-2 yr-1), and (d) annual population turnover (Ptot/W, here as P/B; yr-1) against body mass (M; summed taxa, µg/individual) for the snag-community of the Ogeechee River (GA, USA) and benthic communities of Ball Creek (NC, USA), Sutton Stream and Stony Creek (NZ). Grey line = predicted slope; black line = slope derived from least squares regression. Data & graphics by A. Huryn (University of Alabama). Figure 3. Predicted relationships to be tested: scaling of (a) mass- and temperature-corrected whole-organism nutrient uptake rate or temperature-corrected ecosystem nutrient uptake rate as a function of resource concentration (S),(b) temperature-corrected optimal whole-organism nutrient uptake rate as a function of body mass (M), and (c) the half-saturation constant (Km) as a function of temperature. Slope in (c) represent the activation energy (E) of a given reaction. Enzymatic reactions vary in terms of activation energy.