Download
1 / 24
240 likes | 348 Vues
PROMOTES SOCIAL AND CIVIC ENGAGEMENT Residents maintain connections with friends and neighbors • Figs. 27.1-27.3. Percentage of people age 60+ who socialized with friends or neighbors in the past week Civic, cultural, religious, and recreational activities include older residents

E N D
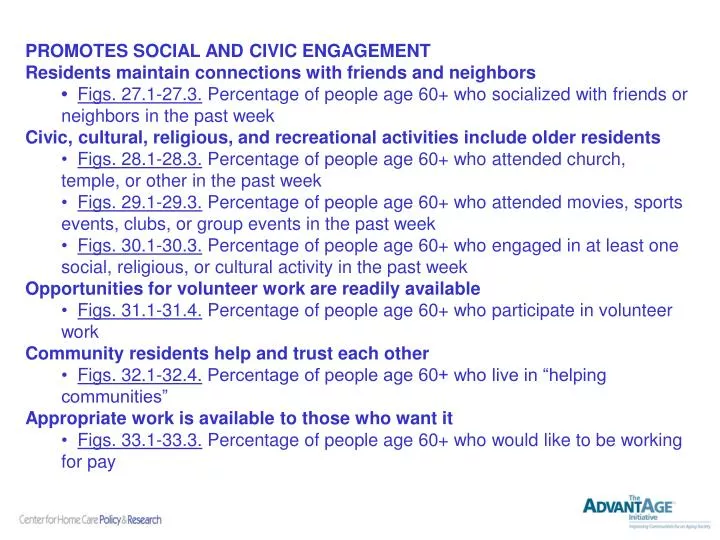
PROMOTES SOCIAL AND CIVIC ENGAGEMENT Residents maintain connections with friends and neighbors • Figs.27.1-27.3. Percentage of people age 60+ who socialized with friends or neighbors in the past week Civic, cultural, religious, and recreational activities include older residents • Figs. 28.1-28.3. Percentage of people age 60+ who attended church, temple, or other in the past week • Figs. 29.1-29.3. Percentage of people age 60+ who attended movies, sports events, clubs, or group events in the past week • Figs. 30.1-30.3. Percentage of people age 60+ who engaged in at least one social, religious, or cultural activity in the past week Opportunities for volunteer work are readily available • Figs. 31.1-31.4. Percentage of people age 60+ who participate in volunteer work Community residents help and trust each other • Figs. 32.1-32.4. Percentage of people age 60+ who live in “helping communities” Appropriate work is available to those who want it • Figs. 33.1-33.3. Percentage of people age 60+ who would like to be working for pay
Figure 27.1, Indiana-Area 3§ Percentage of people age 60+ who socialized with friends or neighbors in the past week* Did not socialize 33% Socialized 67% Unweighted N=300 Weighted N=106,028 Note: Percentages may not add up to 100% due to rounding and/or missing information. *People were asked if they got together with friends or neighbors during the past week. § Area 3 includes Adams, Allen, De Kalb, Huntington, Lagrange, Noble, Steuben, Wells, & Whitley Counties. Source: AdvantAge Initiative Community Survey in Indiana 2008
Figure 27.2, Indiana-Area 3§ Percentage of people age 60+ who socialized with friends or neighbors in the past week,* by demographics Total Age 60-64 Age 65-74 Age 75+ Women Men Unweighted N= 300 Weighted N= 106,028 *People were asked if they got together with friends or neighbors during the past week. § Area 3 includes Adams, Allen, De Kalb, Huntington, Lagrange, Noble, Steuben, Wells, & Whitley Counties. Source: AdvantAge Initiative Community Survey in Indiana 2008
Figure 27.3, Indiana-Area 3§ Percentage of people age 60+ who socialized with friends or neighbors in the past week,* by demographics (cont’d) Total Education >HS Education <HS Ex/vg/good health Fair/poor health Live w/others Live alone Unweighted N= 300 Weighted N= 106,028 *People were asked if they got together with friends or neighbors during the past week. § Area 3 includes Adams, Allen, De Kalb, Huntington, Lagrange, Noble, Steuben, Wells, & Whitley Counties. Source: AdvantAge Initiative Community Survey in Indiana 2008
Figure 28.1, Indiana-Area 3§ Percentage of people age 60+ who attended church, temple, or other in the past week* Did not attend 38% RF <1% ‡ Attended 61% Unweighted N=300 Weighted N=106,028 Note: Percentages may not add up to 100% due to rounding and/or missing information. *People were asked if they went to church, temple, or another place of worship for services or other activities during the past week. ‡ This percentage is based on fewer than 20 respondents (Unweighted N<20) and should be interpreted with caution. § Area 3 includes Adams, Allen, De Kalb, Huntington, Lagrange, Noble, Steuben, Wells, & Whitley Counties. Source: AdvantAge Initiative Community Survey in Indiana 2008
Figure 28.2, Indiana-Area 3§ Percentage of people age 60+ who attended church, temple, or other in the past week,* by demographics Total Age 60-64 Age 65-74 Age 75+ Women Men Unweighted N= 300 Weighted N= 106,028 *People were asked if they went to church, temple, or another place of worship for services or other activities during the past week. § Area 3 includes Adams, Allen, De Kalb, Huntington, Lagrange, Noble, Steuben, Wells, & Whitley Counties. Source: AdvantAge Initiative Community Survey in Indiana 2008
Figure 28.3, Indiana-Area 3§ Percentage of people age 60+ who attended church, temple, or other in the past week,* by demographics (cont’d) Total Education >HS Education <HS Ex/vg/good health Fair/poor health Live w/others Live alone Unweighted N= 300 Weighted N= 106,028 *People were asked if they went to church, temple, or another place of worship for services or other activities during the past week. § Area 3 includes Adams, Allen, De Kalb, Huntington, Lagrange, Noble, Steuben, Wells, & Whitley Counties. Source: AdvantAge Initiative Community Survey in Indiana 2008
Figure 29.1, Indiana-Area 3§ Percentage of people age 60+ who attended movies, sports events, clubs, or group events in the past week* Did not attend 27% Attended 73% Unweighted N=300 Weighted N=106,028 Note: Percentages may not add up to 100% due to rounding and/or missing information. *People were asked if they went to a movie, play, concert, restaurant, sporting event, club meeting, card game, or other social activity during the past week. § Area 3 includes Adams, Allen, De Kalb, Huntington, Lagrange, Noble, Steuben, Wells, & Whitley Counties. Source: AdvantAge Initiative Community Survey in Indiana 2008
Figure 29.2, Indiana-Area 3§ Percentage of people age 60+ who attended movies, sports events, clubs, or group events in the past week,* by demographics Total Age 60-64 Age 65-74 Age 75+ Women Men Unweighted N= 300 Weighted N= 106,028 *People were asked if they went to a movie, play, concert, restaurant, sporting event, club meeting, card game, or other social activity during the past week. § Area 3 includes Adams, Allen, De Kalb, Huntington, Lagrange, Noble, Steuben, Wells, & Whitley Counties. Source: AdvantAge Initiative Community Survey in Indiana 2008
Figure 29.3, Indiana-Area 3§ Percentage of people age 60+ who attended movies, sports events, clubs, or group events in the past week,* by demographics (cont’d) Total Education >HS Education <HS Ex/vg/good health Fair/poor health Live w/others Live alone Unweighted N= 300 Weighted N= 106,028 *People were asked if they went to a movie, play, concert, restaurant, sporting event, club meeting, card game, or other social activity during the past week. § Area 3 includes Adams, Allen, De Kalb, Huntington, Lagrange, Noble, Steuben, Wells, & Whitley Counties. Source: AdvantAge Initiative Community Survey in Indiana 2008
Figure 30.1, Indiana-Area 3§ Percentage of people age 60+ who engaged in at least one social, religious, or cultural activity in the past week None 9% Engaged in one or more activity 91% Unweighted N=300 Weighted N=106,028 Note: Percentages may not add up to 100% due to rounding and/or missing information. § Area 3 includes Adams, Allen, De Kalb, Huntington, Lagrange, Noble, Steuben, Wells, & Whitley Counties. Source: AdvantAge Initiative Community Survey in Indiana 2008
Figure 30.2, Indiana-Area 3§ Percentage of people age 60+ who engaged in at least one social, religious, or cultural activity in the past week, by demographics Total ‡ Age 60-64 ‡ Age 65-74 ‡ Age 75+ ‡ Women Men ‡ Note: Percentages may not add up to 100% due to rounding and/or missing information. Unweighted N= 300 Weighted N= 106,028 ‡ This percentage is based on fewer than 20 respondents (Unweighted N<20) and should be interpreted with caution. § Area 3 includes Adams, Allen, De Kalb, Huntington, Lagrange, Noble, Steuben, Wells, & Whitley Counties. Source: AdvantAge Initiative Community Survey in Indiana 2008
Figure 30.3, Indiana-Area 3§ Percentage of people age 60+ who engaged in at least one social, religious, or cultural activity in the past week, by demographics (cont’d) Total ‡ Education >HS Education <HS ‡ Ex/vg/good health ‡ Fair/poor health Live w/others ‡ ‡ Live alone Unweighted N= 300 Weighted N= 106,028 Note: Percentages may not add up to 100% due to rounding and/or missing information. ‡ This percentage is based on fewer than 20 respondents (Unweighted N<20) and should be interpreted with caution. § Area 3 includes Adams, Allen, De Kalb, Huntington, Lagrange, Noble, Steuben, Wells, & Whitley Counties. Source: AdvantAge Initiative Community Survey in Indiana 2008
Figure 31.1, Indiana-Area 3§ Percentage of people age 60+ who participate in volunteer work* Participate in volunteer work 43% Do not participate in volunteer work 57% Unweighted N=300 Weighted N=106,028 Note: Percentages may not add up to 100% due to rounding and/or missing information. *People were asked if they do volunteer work and if so what type of volunteer work they do. § Area 3 includes Adams, Allen, De Kalb, Huntington, Lagrange, Noble, Steuben, Wells, & Whitley Counties. Source: AdvantAge Initiative Community Survey in Indiana 2008
Figure 31.2, Indiana-Area 3§ Number of hours people age 60+ spend volunteering, among those who volunteer* Less than five hours per week Five to nine hours per week Ten hours or more per week Unweighted N=131 Weighted N=45,602 ‡ Don’t know Note: Percentages may not add up to 100% due to rounding and/or missing information. *People who said they volunteer were asked how many hours they usually spend per week doing volunteer work. ‡ This percentage is based on fewer than 20 respondents (Unweighted N<20) and should be interpreted with caution. § Area 3 includes Adams, Allen, De Kalb, Huntington, Lagrange, Noble, Steuben, Wells, & Whitley Counties. Source: AdvantAge Initiative Community Survey in Indiana 2008
Figure 31.3, Indiana-Area 3§ Percentage of people age 60+ who participate in volunteer work, by demographics Total Age 60-64 Age 65-74 Age 75+ Women Men Note: Percentages may not add up to 100% due to rounding and/or missing information. Unweighted N= 300 Weighted N= 106,028 *People were asked if they do volunteer work and if so what type of volunteer work they do. § Area 3 includes Adams, Allen, De Kalb, Huntington, Lagrange, Noble, Steuben, Wells, & Whitley Counties. Source: AdvantAge Initiative Community Survey in Indiana 2008
Figure 31.4, Indiana-Area 3§ Percentage of people age 60+ who participate in volunteer work, by demographics (cont’d) Total Education >HS Education <HS Ex/vg/good health Fair/poor health ‡ Live w/others Live alone Note: Percentages may not add up to 100% due to rounding and/or missing information. Unweighted N= 300 Weighted N= 106,028 *People were asked if they do volunteer work and if so what type of volunteer work they do. ‡ This percentage is based on fewer than 20 respondents (Unweighted N<20) and should be interpreted with caution. § Area 3 includes Adams, Allen, De Kalb, Huntington, Lagrange, Noble, Steuben, Wells, & Whitley Counties. Source: AdvantAge Initiative Community Survey in Indiana 2008
Figure 32.1, Indiana-Area 3§ Percentage of people age 60+ who live in “helping communities” ‡ ‡ ‡ ‡ 1% ‡ ‡ Unweighted N=300 Weighted N=106,028 Most people in the neighborhood are basically honest and can be trusted If I have a problem there is always someone to help me in this neighborhood Most people in this neighborhood are willing to help if you need it Note: Percentages may not add up to 100% due to rounding and/or missing information. ‡ This percentage is based on fewer than 20 respondents (Unweighted N<20) and should be interpreted with caution. § Area 3 includes Adams, Allen, De Kalb, Huntington, Lagrange, Noble, Steuben, Wells, & Whitley Counties. Source: AdvantAge Initiative Community Survey in Indiana 2008
Figure 32.2, Indiana-Area 3§ Percentage of people age 60+ who live in “helping communities”* Number of statements about helping communities that people “Agreed” with** Agreed with none <1% ‡ Agreed with one ‡ 3% Agreed with two 7% Agreed with three 89% Unweighted N=300 Weighted N=106,028 Note: Percentages may not add up to 100% due to rounding and/or missing information. *People were asked whether they strongly agree, agree, disagree, or strongly disagree with the following 3 statements: “Most people in this neighborhood are basically honest and can be trusted”; “If I have a problem there is always someone to help me in this neighborhood”; “Most people in this neighborhood are willing to help if you need it.” **Percentage of people who “Agreed” includes those who said they “Strongly agree” and those who said they “Agree.” ‡ This percentage is based on fewer than 20 respondents (Unweighted N<20) and should be interpreted with caution. § Area 3 includes Adams, Allen, De Kalb, Huntington, Lagrange, Noble, Steuben, Wells, & Whitley Counties. Source: AdvantAge Initiative Community Survey in Indiana 2008
Figure 32.3, Indiana-Area 3§ Percentage of people age 60+ who live in “helping communities,”* by demographics Number of statements about helping communities that people “Agreed” with ‡ Total ‡ <1% ‡ ‡ ‡ Age 60-64 ‡ ‡ ‡ Age 65-74 ‡ ‡ Age 75+ Women ‡ ‡ ‡ ‡ Men ‡ Note: Percentages may not add up to 100% due to rounding and/or missing information. *People were asked whether they strongly agree, agree, disagree, or strongly disagree with the following 3 statements: “Most people in this neighborhood are basically honest and can be trusted”; “If I have a problem there is always someone to help me in this neighborhood”; “Most people in this neighborhood are willing to help if you need it.” Percentage of people who “Agreed” includes those who said they “Strongly agree” and those who said they “Agree.” Unweighted N= 300 Weighted N= 106,028 ‡ This percentage is based on fewer than 20 respondents (Unweighted N<20) and should be interpreted with caution. § Area 3 includes Adams, Allen, De Kalb, Huntington, Lagrange, Noble, Steuben, Wells, & Whitley Counties. Source: AdvantAge Initiative Community Survey in Indiana 2008
Figure 32.4, Indiana-Area 3§ Percentage of people age 60+ who live in “helping communities,”* by demographics (cont’d) Number of statements about helping communities that people “Agreed” with ‡ Total ‡ <1% Education >HS ‡ ‡ ‡ Education <HS ‡ ‡ Ex/vg/good health ‡ ‡ ‡ <1% ‡ ‡ Fair/poor health Live w/others ‡ ‡ ‡ ‡ ‡ Live alone Note: Percentages may not add up to 100% due to rounding and/or missing information. *People were asked whether they strongly agree, agree, disagree, or strongly disagree with the following 3 statements: “Most people in this neighborhood are basically honest and can be trusted”; “If I have a problem there is always someone to help me in this neighborhood”; “Most people in this neighborhood are willing to help if you need it.” Percentage of people who “Agreed” includes those who said they “Strongly agree” and those who said they “Agree.” Unweighted N= 300 Weighted N= 106,028 ‡ This percentage is based on fewer than 20 respondents (Unweighted N<20) and should be interpreted with caution. § Area 3 includes Adams, Allen, De Kalb, Huntington, Lagrange, Noble, Steuben, Wells, & Whitley Counties. Source: AdvantAge Initiative Community Survey in Indiana 2008
Figure 33.1, Indiana-Area 3§ Percentage of people age 60+ who would like to be working for pay* DK/RF 2% ‡ Would like to work for pay 20% Working part time 11% Not working 76% Would not like to work for pay 78% Working full time 12% DK/RF <1% ‡ Unweighted N=300 Weighted N=106,028 Unweighted N=228 Weighted N=81,085 *People were asked what their current employment status is. *People who were not working were asked whether they would like to be working for pay. Note: Percentages may not add up to 100% due to rounding and/or missing information. ‡ This percentage is based on fewer than 20 respondents (Unweighted N<20) and should be interpreted with caution. § Area 3 includes Adams, Allen, De Kalb, Huntington, Lagrange, Noble, Steuben, Wells, & Whitley Counties. Source: AdvantAge Initiative Community Survey in Indiana 2008
Figure 33.2, Indiana-Area 3§ Percentage of people age 60+ who would like to be working for pay,* by demographics Total ‡ Age 60-64 Age 65-74 ‡ Age 75+ Women Men Base: Currently not working Unweighted N= 228 Weighted N= 81,085 *People who were not working were asked whether they would like to be working for pay. ‡ This percentage is based on fewer than 20 respondents (Unweighted N<20) and should be interpreted with caution. § Area 3 includes Adams, Allen, De Kalb, Huntington, Lagrange, Noble, Steuben, Wells, & Whitley Counties. Source: AdvantAge Initiative Community Survey in Indiana 2008
Figure 33.3, Indiana-Area 3§ Percentage of people age 60+ who would like to be working for pay,* by demographics (cont’d) Total ‡ Education >HS Education <HS Ex/vg/good health ‡ Fair/poor health Live w/others ‡ Live alone Base: Currently not working Unweighted N= 228 Weighted N= 81,085 *People who were not working were asked whether they would like to be working for pay. ‡ This percentage is based on fewer than 20 respondents (Unweighted N<20) and should be interpreted with caution. § Area 3 includes Adams, Allen, De Kalb, Huntington, Lagrange, Noble, Steuben, Wells, & Whitley Counties. Source: AdvantAge Initiative Community Survey in Indiana 2008