Download
1 / 3
0 likes | 3 Vues
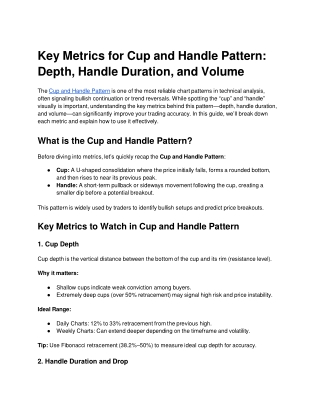
The Cup and Handle Pattern is one of the most reliable chart patterns in technical analysis, often signaling bullish continuation or trend reversals. While spotting the u201ccupu201d and u201chandleu201d visually is important, understanding the key metrics behind this patternu2014depth, handle duration, and volumeu2014can significantly improve your trading accuracy. In this guide, weu2019ll break down each metric and explain how to use it effectively.<br>

E N D
KeyMetricsforCupandHandlePattern: Depth,HandleDuration,andVolume • TheCupandHandlePatternisoneofthemostreliablechartpatternsintechnicalanalysis,oftensignalingbullishcontinuationortrendreversals.Whilespottingthe“cup”and“handle” visuallyisimportant,understandingthekeymetricsbehindthispattern—depth,handleduration, andvolume—cansignificantlyimproveyourtradingaccuracy.Inthisguide,we’llbreakdowneachmetricandexplainhowtouseiteffectively. • WhatistheCupandHandlePattern? • Beforedivingintometrics,let’squicklyrecaptheCupandHandlePattern: • Cup:AU-shapedconsolidationwherethepriceinitiallyfalls,formsaroundedbottom, andthenrisestonearitspreviouspeak. • Handle:Ashort-termpullbackorsidewaysmovementfollowingthecup,creatinga smallerdipbeforeapotentialbreakout. • Thispatterniswidelyusedbytraderstoidentifybullishsetupsandpredictpricebreakouts. • KeyMetricstoWatchinCupandHandlePattern • CupDepth • Cupdepthistheverticaldistancebetweenthebottomofthecupanditsrim(resistancelevel). • Whyitmatters: • Shallowcupsindicateweakconvictionamongbuyers. • Extremelydeepcups(over50%retracement)maysignalhighriskandpriceinstability. • IdealRange: • DailyCharts:12%to33%retracementfromtheprevioushigh. • WeeklyCharts:Canextenddeeperdependingonthetimeframeandvolatility. • Tip:UseFibonacciretracement(38.2%–50%)tomeasureidealcupdepthforaccuracy. • HandleDurationandDrop
Thehandleisthefinalconsolidationphasebeforeabreakout.Twoaspectsarecritical:Thehandleisthefinalconsolidationphasebeforeabreakout.Twoaspectsarecritical: • Duration: • Dailycharts:1–4weeks. • Weeklycharts:Upto6weeksinrarecases. • HandleDrop(Depth): • Ideally5%–10%fromthecuprim. • Shouldnotexceed50%ofthecup’sdepth. • Whyitmatters: • Asmall,controlledhandleindicatesahealthyconsolidationandstrongbuyingpressure. • Alongordeephandlemaysignalindecisionoraweakeningtrend. • VolumeConfirmation • Volumebehaviorprovidescluesaboutpatternvalidity: • Leftsideofthecup:Volumedecreasesasthepricecorrects. • Bottomofthecup:Lowestvolumeindicatesbaseformationoraccumulation. • Rightsideofthecup:Volumepicksupaspricesapproachtherim. • Handle:Lightvolumesignalshealthyconsolidation. • Breakout:Above-averagevolume(40%–50%higherthanaverage)confirmsavalid breakout. • Tip:Withoutvolumeconfirmation,abreakoutmaybefalse,leadingtolosses. • UsingMetricsforBetterTradingDecisions • Whencombiningcupdepth,handleduration,andvolume,traderscan: • Identifyhigh-probabilitybreakoutpoints. • Determinestop-losslevelsbelowthehandleorcupbottom. • Setrealisticpricetargetsequaltothecupdepthaddedtothebreakoutlevel. • Example: • Cupdepth:₹40 • Breakoutat₹220 • Target = ₹220+ ₹40 =₹260
CommonMistakesTradersMake Ignoringcupsymmetryorvisualshape. Tradingwithoutvolumeconfirmation. Misinterpretingthehandledurationordepth. Ignoringthepriortrend,cupandhandleworksbestinanuptrend. Avoidingthesemistakesimprovesriskmanagementandpatternreliability. FinalThoughts MasteringthekeymetricsoftheCupandHandlePattern—depth,handleduration,and volume—isessentialforanyserioustrader.Thesemetricshelpconfirmpatternvalidity,identify breakoutpoints,andmanageriskseffectively.PairthesemetricswithtoolslikeRSI,MACD,or movingaveragesforstrongertradesetups. ProTip:Alwayscombinepatternanalysiswithmarketcontextandvolumetrendstoavoidfalse breakouts.
![[PDF] Free Download You Fit the Pattern By Jane Haseldine](https://cdn4.slideserve.com/8015038/slide1-dt.jpg)


![Sablon Gelas Plastik Tanpa Minimum Order Ö831 418Ö 18Ö8 [WA]](https://cdn5.slideserve.com/10400098/sablon-gelas-plastik-tanpa-minimum-order-0831-dt.jpg)


![Lid Cup Sealer Sablon Custom Ö83I·4I8Ö·I8Ö8[WhatsApp]](https://cdn5.slideserve.com/10622848/lid-cup-sealer-sablon-custom-831-418-18-8-whatsapp-dt.jpg)


