Download

1 / 3
0 likes | 2 Vues
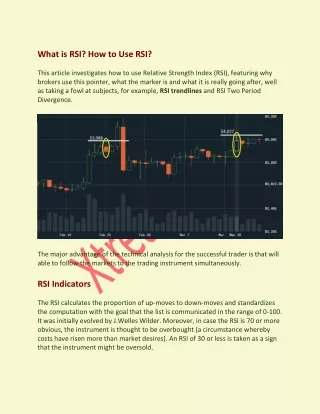
The RSI Indicator in trading is one of the easiest and most useful tools for traders. RSI stands for Relative Strength Index, and it helps you understand whether a stock is moving too fast up or down. Think of it as a speed meter that tells you when the stock market might be getting tired or ready to move again.

E N D
What Is the RSI Indicator in Trading? Click to Edit Sub Title
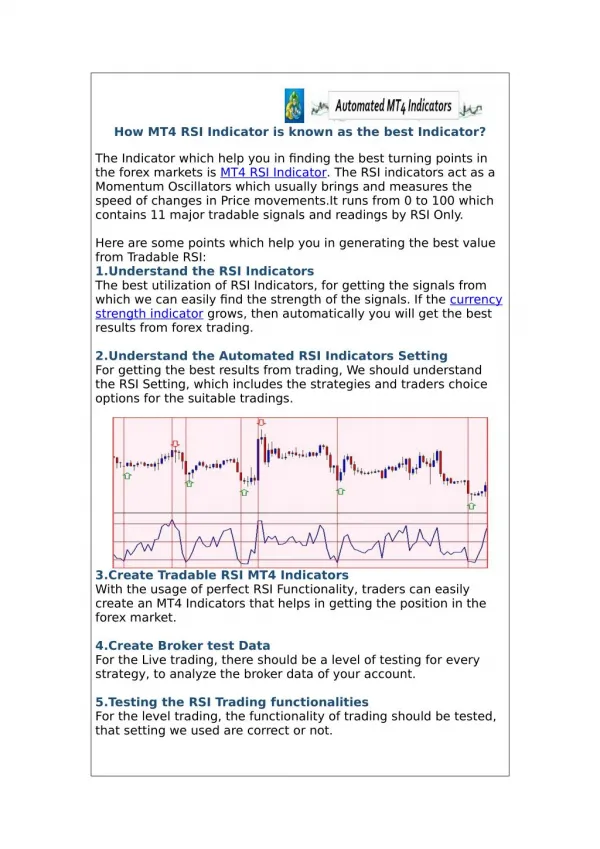
Understanding the RSI Indicator The RSI Indicator moves between 0 and 100. When the number goes above 70, it means the stock is overbought — this could be a signal that prices may soon fall. When the RSI goes below 30, it shows the stock is oversold, meaning the price might start going up again.
Example of RSI in Action Imagine a stock has been rising quickly for days. Now, its RSI shows 80. That means it has become too hot, and traders expect a small fall soon. If the RSI is around 25, the stock is too cold, and it might bounce back up. This helps traders decide when to buy or sell at the right time.