Download
1 / 10
130 likes | 452 Vues
CEM Compass Enhance your Customer Experience Management - Strategy - Execution. London, September 28, 2011. CLOUD. LTE. Cornerstones. Experience and Behavioral Needs; Brand Image. Service Wrap; E2e Customer facing OSS processes. Customer Experience. NETWORKED SOCIETY. Pre-Service;

E N D
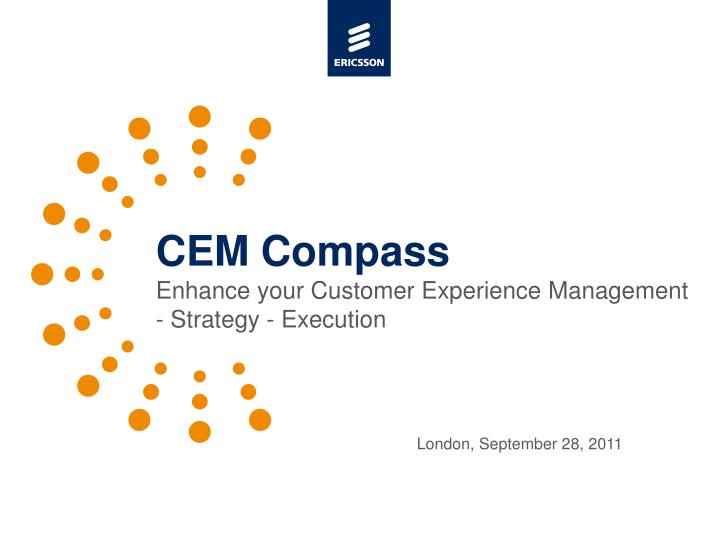
CEM Compass Enhance your Customer Experience Management - Strategy - Execution London, September 28, 2011
CLOUD LTE Cornerstones Experience and Behavioral Needs; Brand Image Service Wrap; E2e Customer facing OSS processes Customer Experience NETWORKED SOCIETY Pre-Service; Marketing CRM In-Service Need; P/S Quality Availability Usability CONNECTED & SMART DEVICES Customer Care, Service and Information, device portfolio resolution and CE competence Moments of Truth Flexible costs Network and and billing Service Quality Moments of Truth Customers’ world is changing, impacting CEM approach Multi-Channel BRAND Interaction
Subscribers on Network Management 750M Subs. Continuing to invest Ericsson India Global Services We have significant experience in CEM thanks to our engagements with operators Customers on Network Support 2B Subs. Consulting and Systems Integration 12.000 Professionals, 1.300 Projects per year
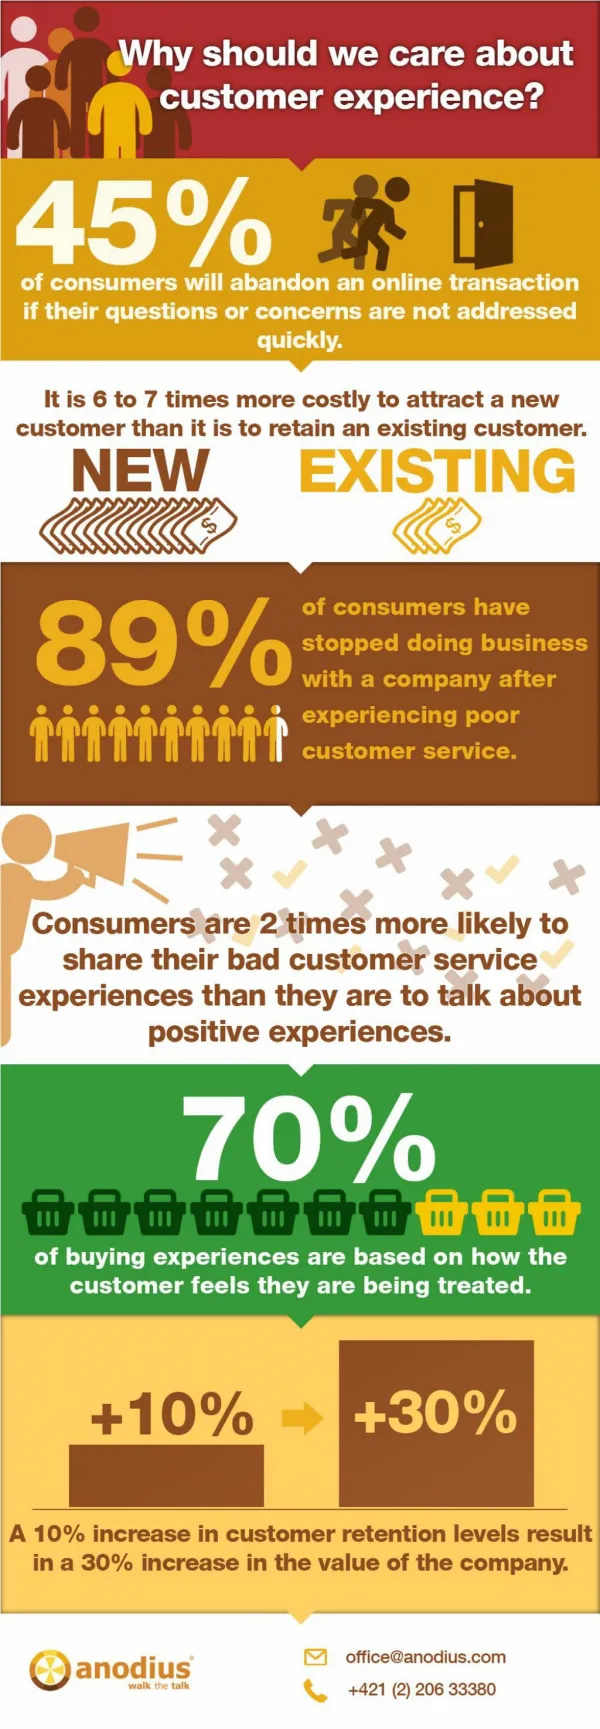
50% Satisfaction Driver is NW Quality. 63% will churn if competitor offers better NW quality.(4) 10% of subscribers base with potential for 1.5 $ ARPU increase if targeted offering(1) Service quality optimization allowed operator to increase 13% market share (2) MBB service with better data activation would create additional 20m $ FCF in four years (3) Discovering insights is fundamental to obtain value investing in a CEM journey Sources; (1) Operator Case, (2) Operator Case, (3) Operator Case (4) ConsumerLab Network Quality Study 2010,
Market context Results achieved • Discovery of micro-segment; opportunity to build targeted offering with potential ARPU increase of 1.5$ for 10% of subscribers base • Very competitive market, advanced services and infrastructure, differentiation challenge • Exploration and trial of Dynamic Pricing for churn reduction and ARPU booster Ericsson Dynamic Pricing and go to market consulting approach 3 Features and Roadmap 1 Strategy and Focus DP GTM Collateral Implications Analysis & Design Planning Integration & Implementation TRIAL 2 Evaluation & Evolution 4 Target Segmentation Insights impacting CEM process areas Micro Segment Case: Segmentation and targeting enhances CEM strategic direction
Results achieved Market context • Automated and standardized processes • Total visibility of the quality of the network • Leading operator with 6 million subscribers, holding 24 percent market share • Continuing to introduce new standards in terms of service quality and pricing Ericsson network performance partnership with user service performance approach Performance Commitment Performance Levels Implemented Current Performance Optimized Performance Partnership Solution Agreement Baseline and Target Assessment Transformation Insights impacting CEM process areas Service Quality Usage Uptake Case: Performance optimization improves CEM real-time control
Results achieved Market context • Foundation for Performance Based Service Assurance (Experience Map, SKPIs, RKPIs) • Automated service monitoring and reporting • Operator explore innovative business models to stay ahead of competition • Satisfaction levels declined due to mobile data service quality and experience Ericsson customer touch-points framework (LCM) sample approach Data Activation Experience Map Architecture Recommendation Data Readiness Quick-Wins Device Activation Assessment and Finance Impact Insights impacting CEM process areas Pay Get Find Get Setup Use Modify for help Case: CEM automation on Customer Lifecycle Management framework
Results achieved Market context • Establishment of satisfaction drivers KPIs • Network Quality Index with diary network issue category & details • Developing market with aggressive churn • Operator exploring on network and systems data and applicability to marketing Ericsson market research and technology consulting approach Profiling Questions, Diary exercise, Survey & CDRs Satisfaction Driver Model & NPS Network Quality Churn impact Revenue Risk Assessment Map perception / System data KPIs Diagnosis Insights impacting CEM process areas Case: Diagnosis tool enhances satisfaction drivers and KPIs
loyalty Customer Segmentation and Targeting Customer Satisfaction Understanding CLV performance priority Acting Customer Lifecycle Management Customer Experience Optimization differentiation Summary: Navigating CEM on 360° compass increasing Customer Lifetime Value