Download
1 / 33
330 likes | 493 Vues
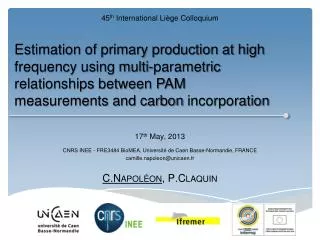
45 th International Liège Colloquium. Estimation of primary production at high frequency using multi-parametric relationships between PAM measurements and carbon incorporation. 17 th May, 2013 CNRS INEE - FRE3484 BioMEA , Université de Caen Basse-Normandie, FRANCE

E N D
45th International Liège Colloquium Estimation of primary production at high frequency using multi-parametric relationships between PAM measurements and carbon incorporation 17th May, 2013 CNRS INEE - FRE3484 BioMEA, Université de Caen Basse-Normandie, FRANCE camille.napoleon@unicaen.fr C.Napoléon, P.Claquin
Why the primary production ? Every trophic level relies on Primary production Phytoplankton
Why the English Channel ? English Channel a strategic area only few data Position of stations used for the validation of the MIRO&CO model. Lacroix et al. (2007)
Method Normandie Brittany Ferries Ouistreham Portsmouth Portsmouth Ouistreham
Method Normandie Brittany Ferries Ouistreham Portsmouth - 4 m
Method Light Temperature Turbidity Salinity Multi-parameters Probe Nutrients (DIN, DIP, DSi) Chla Suspension Matter Phytoplankton species (pico, nano, micro) Water flow
Method The PAM method Calvin cycle Carbohydrates CO2 H+ Fluorescence variation of the PSII Production of electrons ATP ADP+Pi NADP+ NADPH+ H+ H+ ATPase STROMA Fd PSII PSI e- e- LUMEN H2O O2 + H+
Method Nutrients (DIN, DIP, DSi) Chla SPM Phytoplankton species (pico, nano micro) Temperature Turbidity Salinity Multi-parameters Probe Dark tank 100ml Solenoid valves interface emitter-detector unit Water flow PAM Control Unit Solenoid valve 8
Method Fast (10 minutes) Economic Non invasive Automatic The PAM method ETRmax Maximal electron transport rate α Maximal light utilization efficiency
How to estimate primary production at high frequency ? Ouistreham Portsmouth Portsmouth (GB) Ouistreham (FR) November 2009 December 2010
How to estimate primary production at high frequency ? High frequency BUT Production of electrons! NOT Carbon incorporation! Portsmouth (GB) Can we use high frequency ETR measurements to estimate carbon incorporation at high frequency? Ouistreham (FR) November 2009 December 2010
How to estimate primary production at high frequency ? 13C Carbon incorporation Calvin cycle Calvin cycle Carbohydrates H+ Fluorescence variation of the PSII Production of electrons ATP ADP+Pi NADP+ NADPH+ H+ H+ ATPase STROMA Fd PSII PSI e- e- LUMEN H2O O2 + H+
How to estimate primary production at high frequency ? The photosynthetron 13C Light
How to estimate primary production at high frequency ? PAM 13C Advantages Advantage • Fast (10min) • Economic • Non invasive • Automatic • Gives access to the carbon incorporation Disavantages Disadvantage • Requires a long time of incubation (3h) • Costly • Does not give access to the carbon incorporation High frequency measurements Low frequency measurements
How to estimate primary production at high frequency ? 13C Carbon incorporation Calvin cycle Calvin cycle Carbohydrates H+ Fluorescence variation of the PSII Production of electrons ATP ADP+Pi Factor ? NADP+ NADPH+ H+ H+ ATPase STROMA Fd PSII PSI e- e- LUMEN H2O O2 + H+
How to estimate primary production at high frequency ? Relationship? C = f(ETR) C C ETR ETR
How to estimate primary production at high frequency ? What kind of relationship ? What kind of relationship? Logarithmic relationship Photoregulation at high light to protect the cell from photoinhibition by damages Alternative electron sinks -cyclic electron flow around PSI, PSII -Mehler reaction -Reduction of nitrate -Photorespiration More electrons needed to fix 1 mole of C. C = 0.1503 + 0.0496 * ln(ETR)
How to estimate primary production at high frequency ? What kind of relationship ? What kind of relationship? Influence of physicochemical and biological parameters? C = f(ETR) + a*v1 + b*v2 + …. Physicochemical parameters? Biological parameters? Logarithmic relationship In situ C = 0.1503 + 0.0496 * ln(ETR)
How to estimate primary production at high frequency ? Influence of physicochemical and biological parameters? C = 0.2082+0.0496 * ln(ETR) - (0.319 * DIP) + (0.000166 * PAR) C = 0.2082+0.0496 * ln(ETR) In situ - (0.319 * DIP) + (0.000166 * PAR)
How to estimate primary production at high frequency ? Can we use high frequency ETR measurements to estimate the carbon incorporation at high resolution YES ! Portsmouth (GB) BUT… However, difficulties to discriminate parameters in in situstudies DIP and light = good integrator of other parameters? Ouistreham (FR) November 2009 December 2010 C = 0.2082+0.0496 * ln(ETR) - (0.319 * DIP) + (0.000166 * PAR)
How to estimate primary production at high frequency ? Variability of C.e ? Ouistreham Portsmouth ᶲC.e = P (carbon incorporation) / ETR Portsmouth (GB) Ouistreham (FR) January 2010 December 2010
How to estimate primary production at high frequency ? Variability of C.e ? Ouistreham Portsmouth ᶲC.e = P (carbon incorporation) / ETR Portsmouth (GB) Ouistreham (FR) January 2010 December 2010
How to estimate primary production at high frequency ? Variability of C.e ? Ouistreham Portsmouth ᶲC.e = P (carbon incorporation) / ETR Portsmouth (GB) Ouistreham (FR) January 2010 December 2010
How to estimate primary production at high frequency ? Variability of C.e ? Ouistreham Portsmouth ᶲC.e = P (carbon incorporation) / ETR Portsmouth (GB) Ouistreham (FR) January 2010 December 2010
How to estimate primary production at high frequency ? Variability of C.e ? = 0.2082+0.0496 * ln(ETR) - (0.319 * DIP) + (0.000166 * PAR) ᶲC.e = P (carbon incorporation) / ETR Small cells = high surface/volume Low DIP concentrations High ᶲC.e DIP = good integrator of the effect of small cells on ᶲC.e
Main results The shape of the relationship between PAM measurements and carbon incorporation is logarithmic due to alternative electron sinks at high light. Using a multi-parametric model, we can obtain a good estimation of the carbon incorporation at a high spatio-temporal scale, coupling low frequency measurements of carbon incorporation, and high frequency measurements of ETR. The study also highlights the importance of taking into account the functional group into the estimation of C.e and particularly the dynamics of small cells. Alternative electrons sinks C C ETR ETR
How to estimate primary production at high frequency ? What kind of relationship ? RUBISCO Calvin cycle Oxygenase Carboxylase CO2 Carbohydrates H+ ATP ADP+Pi NADP+ NADPH+ H+ H+ ATPase STROMA Fd PSII PSI e- e- LUMEN H2O O2 + H+
How to estimate primary production at high frequency ? What kind of relationship ? RUBISCO Calvin cycle Oxygenase Cyclicelectron flow around PSI Carboxylase CO2 Carbohydrates Cyclicelectron flow around PSII H+ NADPH+ H+ ATP ADP+Pi NADP+ H+ ATPase STROMA Fd PSII PSI e- e- LUMEN H2O O2 + H+
How to estimate primary production at high frequency ? What kind of relationship ? RUBISCO Calvin cycle Oxygenase Mehler reaction Carboxylase CO2 Carbohydrates H+ NADPH+ H+ ATP ADP+Pi NADP+ H+ ATPase O2 STROMA Fd O2- H2O2 H2O PSII PSI e- e- LUMEN H2O O2 + H+
How to estimate primary production at high frequency ? What kind of relationship ? RUBISCO Calvin cycle Oxygenase Nitrate reductase Carboxylase CO2 Carbohydrates H+ NADPH+ H+ ATP ADP+Pi NADP+ H+ ATPase NO-3 STROMA Fd NO-2 PSII PSI e- e- LUMEN H2O O2 + H+
How to estimate primary production at high frequency ? What kind of relationship ? Calvin cycle RUBISCO Photorespiration CO2 Oxygenase O2 Carboxylase CO2 Carbohydrates H+ NADPH+ H+ ATP ADP+Pi NADP+ H+ ATPase STROMA Fd PSII PSI e- e- LUMEN H2O O2 + H+