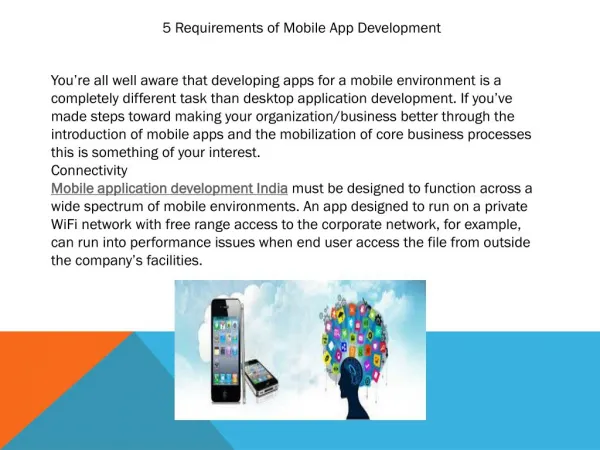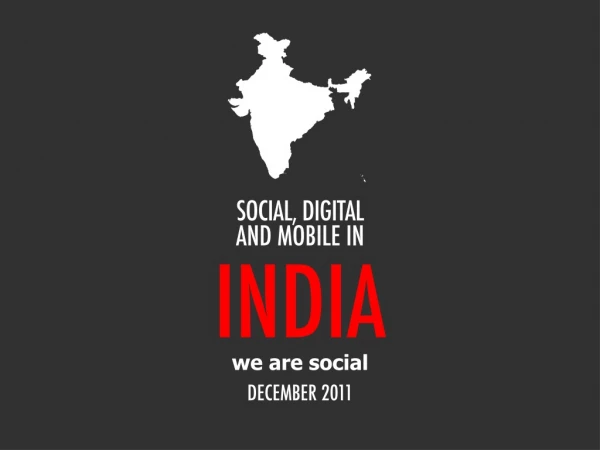
India Mobile 2011
India Mobile 2011. ‘Mobile phone users’ in India and their ‘mobile usage behavior and preferences’. Study Overview. Most ‘recent and representative’ survey-based estimates of mobile phone users in urban and rural India

India Mobile 2011
E N D
Presentation Transcript
India Mobile 2011 ‘Mobile phone users’ in India and their ‘mobile usage behavior and preferences’
Study Overview • Most ‘recent and representative’ survey-based estimates of mobile phone users in urban and rural India User-ship estimates is based on a very large land survey among 201,839 individuals spread across all mainland states & union territories (covering all the 23 telecom circles) of the country. The survey was conducted between Apr-Mid June 2011 among 32,876 households in 104 cities and 15,889 households in 766 villages – a total of 48,765 households • Most ‘comprehensive’ profiling of Indian mobile users – in their demographics, psychographics and key mobile usage dynamics A deeper profiling of the Indian mobile users, their consumption lifestyle and their mobile usage - including details about their location, economic status, day-to-day lifestyle habits & preferences, and their mobile handset and service usage patterns and preferences Demographic profiling and individual level SIM and handset ownerships data is based on all mobile using individuals living in the surveyed households (74,237). Mobile usage details and lifestyle profiling is based on the mobile using ‘respondent’ members(34,645)
Methodology Overview • A large-scale land survey was conducted to estimate and profile the Indian mobile users. The survey covered ‘towns’ and ‘villages’ of all population strata in all the mainland states and and UTs in India (covering all the key 80 of the total 88 regions in India as classified by NSSO) – all 23 telecom circles were covered extensively • The selection of towns and villages was done to attempt a best possible but practical ‘geographical’ coverage of the Indian population. The sampling within the selected towns was done on ‘2-stage random’ basis(firstly a random selection of polling booths, and then a random selection of households from the electoral list within each of these randomly selected polling booths); within villages, sampling was done on ‘systematic random’ basis(selection of every nth house in the village) • To estimate the mobile user-ship correctly and to make the findings representative of all mobile users in India (and not just of those surveyed), telecom circle-wise, urban district/village class and SEC combination level ‘household representation weights’ as derived from authentic ‘Govt. of India’ base-level population statistics (NSSO/Census) were applied to the survey data. TRAI data was also used to bring in appropriate ‘telecom circle level’ and ‘operator level’ representations
103 mn mobile users added in last 1 year* • Mobile subscribers(user base)in India grew 34% to reach 407 mn(from 303 mn last year) • ‘Active’ mobile subscriptions(active SIM base) grew 37% to reach 487 mn(from 355 mn last year) • Avg ‘users’ per household remain at 2.05;Avg ‘active SIMs’ per user is up marginally at 1.20 • While the ‘individual’ level penetration is up at 34%, tele-density is up at 40% (from 31% last year) • Almost 60% of all Indian households are still ‘single’ mobile user households • User base of active ‘multiple SIM’ users grew by 20 mn(44%) to touch 65 mn * As of May-June 2011
Growth driven more by Rural India • Rural India overtakes urban India on the base of both ‘users’ as well as ‘active SIMs’ • Rural India saw higher increases in both ‘penetration’ & ‘tele-density’ (as compared to urban India) • Growth of subscribers was relatively more in ‘North’ and ‘South’ Indian circles • Though ‘B’ circles still account for the largest chunk of mobile users, ‘A’ circle grew the most • ‘UP West’ showed the highest increase in user base, ‘UP East’ the highest increase in SIM base
Usage flattens, spends drop • The daily average talk time on ‘most used connection’ is up marginally at 24.7 minutes(from 23.5 minutes last year) • However, the average monthly spends on ‘most used connection’ went down 11% to `215(from `242 last year). On an average, rural users claim to spend about 17% less than the urban users • ‘Outgoing STD’, ‘call waiting’ and ‘domestic roaming’ remain the most used services • Mobile users surfing internet on their mobile phones grew slowly (25%) to reach only 14.4 mn(3.5% of all Indian mobile users). However, 101 mn mobile connections (21%) have used ‘data’ services • 9 out of 10 internet using mobile users remain ‘dual device’ users(accessing internet on both mobile and PC)
Service Providers – Subscriber Shares Overall(%)
91 mnmobile handsets added in last 1 year* • There are 446 million ‘active’ mobile handsets in use (up 26% from 355 million last year) • Average handsets per user has gone down marginally to 1.1(1.17 last year). 91% mobile users are ‘single’ active mobile handset users • Almost 5% of all mobile handsets in use (22 million) are ‘Dual SIM’ handsets • 82% of all mobile handsets are claimed to have been bought at below `3,000 price point. Claimed ‘average’ handset buying price in rural areas (at `2,078) is approx. 15% lower than urban areas average buying price • 80% of the ‘most used handsets’ have games on them, 55% have FM and 18% have a camera. Only 6% are internet enabled (WAP/GPRS/EDGE/Wi-Fi). 15% mobile users use handset ‘menu’ in local Indian languages * As of May-June 2011
Mobile User Profile • ‘25-35 years’ and ‘13-18 years’ age groups have gained user base the most in last 1 year • 2 out of 3 mobile users are ‘employed’; 70% of these employed ‘head’ their households • Though their proportion declined marginally, ‘housewives’ still form the second biggest occupational group of mobile users in India.Almost 1 in 7 mobile user is a ‘student’ • 2/3rd of all mobile users are educated completely in ‘vernacular’ languages • Sec ‘E’ in urban areas and SEC ‘R4/R5’ combine in the rural areas have shown the highest increase in user base in last 1 year (suggesting a ‘deepening’ of penetration of mobiles phones in the Indian society) • ‘Lower’ income class(below `6,250 MHI) becomes the single largest ‘mass’ of Indian mobile users (40%)
Lifestyle Orientation • ‘Money’ is the single biggest motivator driving lives of over half of all mobile users (urban or rural) • ‘Listening to music’ and ‘cinema’ remain their biggest hobbies. Computer games and adventure sports gain noticeable popularity in last one year • ‘Watching TV’ is their biggest indoor entertainment, followed by ‘listening to music’. ‘Watching movies in cinema hall’ and ‘eating out’ are the most popular outdoor activities among them • While 4 out of 5 mobile users claim to watch TV, only 1 in 3 claim to read newspaper • Brand imageis the biggest ‘single most important’ factor mobile users consider while buying products or services (41%), followed by price(30%). Price becomes more important at ‘multiple factors’ consideration level
Reporting • Like in 2010, the India Mobile 2011 study findings will be available as query-based online datasetswith findings presented as tables/graphs/charts • There are two overall level datasets: • India Mobile Service - with findings presented on the base of ‘all mobile service users’ and data displayed by telecom circle types (Metro, A, B and C) • India Mobile Handset - with findings presented on the base of ‘all mobile handset owners’ and data displayed by city types (Metros, Tier 2, Tier 3, Tier 4) • In addition, there are individual telecom circle-wisedatasets Note: Reporting by any telecom circle or brand in the supplement dataset is subject to collection of sufficient sample responses in the survey
Pricing* Overall Mobile User Level Dataset Supplementary Level Datasets Single Datasets India Mobile Service Rs. 250,000 (data at all India, urban, rural and ‘circle type’ level only) India Mobile Handset Rs. 250,000 (data at all India, urban, rural and ‘city type’ level only) Telecom Circle-wise Datasets Rs. 100,000 per telecom circle (data at the ‘individual telecom circle’ level only) Combo Datasets Up to 5 telecom circle-wise datasets + Rs. 500,000 India Mobile Master Dataset (data at all India, urban, rural, circle type, city type, village type and top 20 individual urban district levels) 6 - 12 telecom circle-wise datasets + Rs. 700,000 + All telecom circle-wise datasets Rs. 900,000 * Key Findings PowerPoint Report for any dataset (only on order) – Rs. 50,000 per dataset * 10.3% service tax extra
Payment Terms & Delivery • Payment Terms : 50% advance, 50% after delivery of all datasets/reports • Delivery Timeline : Overall Level Datasets (India Mobile Service / India Mobile Handset) • Week of 15th August 2011 • : Supplementary Level Datasets (telecom circle wise) • 2 days thereafter from date of order • : PowerPoint Report • 1 week per dataset report thereafter from date of order • Reporting Format : Query access based online dataset
India Mobile 2011(Information Coverage) Size Estimates of Mobile Users in India (All India, Urban/Rural, By Circles, By Operators, By Connection Tech, By Connection plan) • Total mobile phone using households, No. of mobile phones users per household, Total no. of connections (SIMs) and handsets in the household, Total no. of ‘active’ connections (SIMs) and ‘active’ handsets in the household • Total mobile phone using individuals, ‘Total’ as well as ‘active’ mobile phones per individual (SIMs and Handsets), No. and proportion of 3G connections, No. of 3G compatible handsets, No. of ‘dual SIM’ handsets Geographics of Mobile Users • Region, State, Telecom circles, Urban/Rural, Circle Type, City Type, Village Type, Top 20 individual urban districts Mobile Service Usage • Connection Usage: No. of SIMs, Service providers of all SIMs, Type of connection technology, Type of connection plan, Average minutes talked daily, Monthly bill, Whether uses internet on any of these SIMs, Mode of accessing internet on mobile phone (or reason for not using internet on mobile) • Whether switched connection using number portability with service provider switched, Likeliness of switching connection using number portability, Likeliness of taking up a 3G connection in next 6 months • Service Provider of most used SIM, Voice and Data Services subscribed on this most used connection, Type and brand of mobile applications used on this most used connection
India Mobile 2011(Information Coverage) Mobile Handset Usage • Handset Usage: No. of handsets, Handset brand, Handset price (at the time when bought) • Handset brand of most used SIM, Features present on this most used handset, Language used to operate this most used handset • Whether listens to music on mobile phone or a mobile device Personal Demographics of Mobile Users • Gender, Age, Marital Status, Generational classification by age, Status in the household (CWE, other earning or dependent member of the HH, Occupation, Individual Income (if earning) • Education, Medium of Education, Mother Tongue, Preferred language of reading, Religion Personal Psychographics of Mobile Users • Most important priorities in life currently, Current hobbies and interests, Living celebrity currently identify with the most • Favorite indoor entertainment activities, Favorite outdoor entertainment activities • Attributes give weight-age to when buying products and services
India Mobile 2011(Information Coverage) Personal Consumption Habits & Lifestyle • Type of vehicle drives individually (car, scooter, motorcycle) • Whether individually has a saving account, demat account, credit card, life insurance, medical insurance • Whether a computer user and type of computer if used at home • Whether an internet user, place and device of accessing internet, frequency of accessing internet Personal Media Usage • Whether use TV, Radio, Newspaper and Magazines, with duration of usage on weekdays and weekends • Type of TV content watched and the most watched channels for each type (Entertainment/Serials/Reality Shows, News, Movies, Music, Business News & Info, Spiritual/Devotional, Sports, Cartoon) • Type of newspaper/magazine read and the most read brands for each type (Regular Newspaper, Business Newspaper, Regular Magazine, Business Magazine) • Most listened to radio channels Household’s Socio-Economic Profile • Family size, Family classification by lifecycle stage • Highest occupation & education levels in the HH, Neo-SEC Classification, CWE Occupation & Education, Conventional SEC classification
India Mobile 2011(Information Coverage) • Monthly Household Income (MHI), No. of earning members in the family, Average per capita household income • Ownership status and size (carpet area) of house living in • Asset owned in the household (House, Car, Motorcycle, Scooter, Bicycle, TV, TV Connection, Fridge, Washing Machine, Air Conditioner, Microwave, Music system, Portable music player, VCD/DVD player, Regular Camera, Digital Camera, Video Camera, Computer, Video Games, Food processor, Water purifier, Toaster/Sandwich maker, Power backup, Landline phone, Tractor, Tube well/Pump, Transistor/Radio) • Type of asset owned in the household and brand owned for the following assets (Fridge, TV, TV Connection, Washing Machine, Car, Motorcycle, Scooter, Computer) • Financial asset ownerships (Saving Bank Account, Fixed Deposit, RBI/Govt. Bonds, Demat Account, Medical Insurance, Accidental Insurance, House Insurance, Mutual Funds, Company Shares/Stocks, Chit Fund Deposits, Crop Insurance) • Type of currently running loans if any
Contact Details • Address : 7, Kehar Singh Estate, Westend Marg Lane 2, Said-ul-Ajaib, New Delhi – 110030 • Telephone : +91-11-29535098, +91-9811256502 • Contact Person : Sanjay Tiwari • Email : sanjay@juxtconsult.com • Website : www.juxtconsult.com