Understanding the Shift in Physician Compensation: A Deep Dive into Payment Structures and Impacts
260 likes | 377 Vues
This presentation explores the complexities of physician compensation, focusing on the transition from fee-for-service (FFS) to alternative payment programs (APP) in British Columbia. It highlights the growth of non-FFS payments and their implications for physician productivity and service delivery. The data shows a significant rise in total physician expenditures compared to FFS payments, raising questions about the transparency and accountability of APPs. This critical analysis aims to provide insights for effective management and policy-making in healthcare.

Understanding the Shift in Physician Compensation: A Deep Dive into Payment Structures and Impacts
E N D
Presentation Transcript
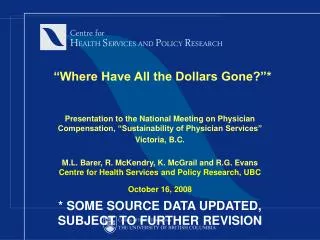
“Where Have All the Dollars Gone?”* Presentation to the National Meeting on Physician Compensation, “Sustainability of Physician Services” Victoria, B.C. M.L. Barer, R. McKendry, K. McGrail and R.G. Evans Centre for Health Services and Policy Research, UBC October 16, 2008 * SOME SOURCE DATA UPDATED, SUBJECT TO FURTHER REVISION
Non-FFS payments represent an eclectic mix….. Benefits e.g. disability insurance, CME, CMPA, maternity, RSP Incentives e.g. rural incentives, isolation allowance, recruitment/retention, full-service family practice, medical on-call Service-related Salary, sessional, service agreements
Share of physician compensation by type of remuneration, BC, 1992/93 and 2006/07
Loss of Information during this Transition • The new alternative payment programs provide less detail on physician activity, and • Reporting detail on the programs themselves is increasingly incomplete. • FOR EXAMPLE …:
Three Phases of MSC Spending, • Spending per capita adjusted for fee changes, (an index of “real” service output), has moved steadily upward for 36 years • After 1990, however, the mix of forms of payment to physicians began to change • In the 1990s, FFS payments flattened • After 1998, alternative payment forms expanded rapidly
BC MSC Expenditure, Total and Components, constant $1991/92 p.c., NPDB Fee Index, 1969/70 to 2007/08
% Growth in B.C. MSC Expenditures per capita per annum, Fee-Adjusted 69-07 69-90 90-98 98-01 01-07 Total 2.55 3.47 0.53 2.94 1.88 Medical 2.63 3.60 0.52 3.82 1.50 FFS 1.98 3.51 -0.53 1.15 0.50 APP 8.07 5.60 14.35 16.81 4.54 S&S&S** 6.01 5.60 7.92 16.24 0.17 FFS+3S 2.27 3.60 0.03 2.73 0.45 FFS+1/2 3S 2.13 3.56 -0.24 1.99 0.47 * Alternative Payment Programs ** Salaried, sessional, and service agreements (3S)
But are physicians in APP as “productive” as those paid FFS? • “FFS+3S” assumes that physicians paid by salary, sessional, and service agreements are equally productive (potential billings) • “FFS+1/2 3S” assumes (as an extreme) that they are only half as productive • Either way, the volume of physicians’ services per capita has been rising -- but how fast? Because APP activity is largely undocumented, we do not know
% Growth in B.C. Physician Prices Relative to CPI 69-07 69-90 90-98 98-01 01-07 Fees, -0.32 -0.47 -0.81 2.90 -0.75 APP Gain* 0.35 0.00 0.49 1.06 1.04 Total 0.02 -0.47 -0.32 3.99 0.28 *De facto price increase, from increases in APP not matched by service increases. “3S” activity assumed as productive as FFS.
% Growth in Physician Expenditures p.c.p.a., Fee-Adjusted, 1999/00 to 2005/06, CIHI sources B.C. Ten Province Total, NHexT 3.07 2.11 “Total”, NPDB 2.56 0.89 FFS, NPDB 0.54 -0.37 APP Clinical, NPDB 16.62 14.54 FFS+APPClin NPDB 2.71 1.79 Clin-NOC NPDB 1.10* 1.20* Clin-NOC-.5 APPClin NPDB 0.84** 0.47** *Northern and On Call payments removed as not service related. **Half of other Clinical APP also removed as possibly less “productive”
So what do we we know? Payment to physicians have risen faster than payments for service programs, and much faster than payments for FFS This implies that total prices paid per service have risen significantly faster than fee schedules – the previous slide is a minimum estimate The estimated volume of physicians’ services provided, per capita, to British Columbians appears nevertheless to have gone up, but we have no way of being more precise
Implications for management Can’t do blind temporal comparisons with head in sand Losing increasing amounts of management information over time Information losses vary by region and specialty Some of regions and specialties where information losses are greatest are of critical importance re: e.g. access
Flashlight through the fog…. Challenge is to move back toward origin of management information ‘graph’ Create incentives for provision of accurate shadow billing data where not currently being provided Advocate for management-friendly EMR (and access for management purposes)
UBC Centre for HealthServices and Policy Research For more information: mbarer@chspr.ubc.ca bevans@chspr.ubc.ca www.chspr.ubc.ca