Download
1 / 70
700 likes | 833 Vues
To protect, promote and improve the health of all people in Florida through integrated state, county, and community efforts. Created: 12/27/13 Revision: 04/18/14. Epidemiology of HIV Infection Trends in Florida Reported through 2013. Florida Department of Health

E N D
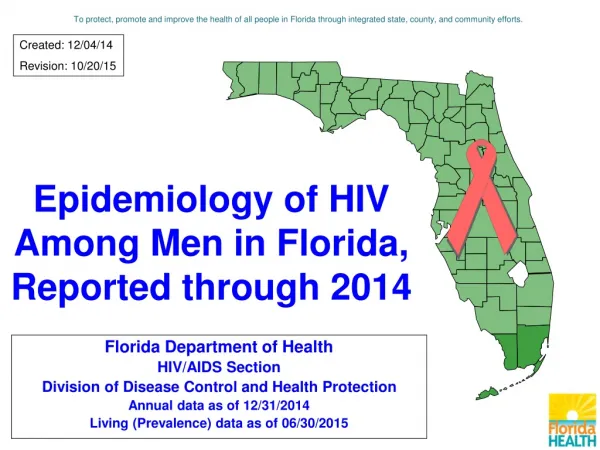
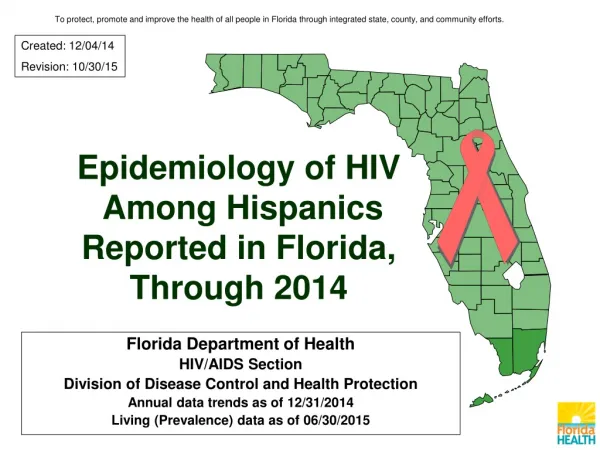
To protect, promote and improve the health of all people in Florida through integrated state, county, and community efforts. Created: 12/27/13 Revision: 04/18/14 Epidemiology of HIV Infection Trends in Florida Reported through 2013 Florida Department of Health HIV/AIDS and Hepatitis Section Division of Disease Control and Health Protection Annual data as of 12/31/2013
HIV and AIDS Case Data • HIV Infection reporting represents newly reported HIV cases, regardless of AIDS status at time of report. • HIV infection cases classified as Stage 3 (AIDS) became reportable in Florida in 1981. • HIV infection cases (without an AIDS diagnosis) became reportable in Florida on July 1, 1997. • AIDS cases and HIV infection cases by year of report are NOT mutually exclusive and CANNOT be added together. • Frozen databases of year-end data are generated at the end of each calendar year. These are the same data used for Florida CHARTS and all grant-related data where annual data are included. • HIV prevalence data are prepared later in the year, when most of the “expected” death data are complete, usually in July.
HIV and AIDS Case Data (con’t) • Adult cases represent ages 13 and older, pediatric cases are those under the age of 13. For data by year, the age is by age of diagnosis. For living data, the age is by current age at the end of the most recent calendar year, regardless of age at diagnosis. • Unless otherwise noted, whites are non-Hispanic and blacks are non-Hispanic. • Total statewide data will include Department of Correction Cases (DOC) unless otherwise noted. County data will exclude DOC cases. • HIV “incidence estimates” are approximations of the numbers of people who are newly infected, which include those whose infection has not yet been diagnosed or reported.
Surveillance Case Definition for AIDS in Florida under age 6 • Laboratory evidence and/or medical documentation by a physician of a person with a positive confirmatory HIV antibody test and/or positive virologic test (qualitative or quantitative) and • For children under age 6: • Has been diagnosed with one or more AIDS-defining illness (Opportunistic Infections)
Surveillance Case Definition for AIDS in Florida age 6 and older • Laboratory evidence and/or medical documentation by a physician of a person with a positive confirmatory HIV antibody test and/or positive virologic test (qualitative or quantitative) and • For persons 6 years of age or older: • Has a CD4 absolute lymphocyte count below 200, or a CD4 of less than 14% total lymphocytes and/or • Has been diagnosed with one or more AIDS-defining illness (i.e., Opportunistic Infections) excluding multiple or recurrent bacterial infections
Surveillance Case Definition for HIV in Florida • Laboratory Criteria • Positive result on a screening test for HIV antibody, followed by a positive result on a confirmatory test for HIV antibody (e.g., Western blot, IFA, multispot, etc) • OR • Positive result or report of a detectable quantity of any of the following HIV virologic (non-antibody) tests: • HIV nucleic acid (DNA or RNA) detection test (e.g., polymerase chain reaction [PCR]) Has a CD4 of less than 14 percent total lymphocytes • HIV p24 antigen test, (excluding neutralization assay) • HIV isolation (viral culture)
HIV Infection Reporting in Florida • HIV Case Reporting in Florida is based on a positive antibody or antigen test for HIV: • HIV (not AIDS) cases became reportable in Florida on 07/1997, but only via confirmatory Western Blot (antibody) HIV tests. Reporting was NOT retroactive. Previously positive tests required re-testing with a confirmatory test before they could become reportable. • Viral load (antigen) HIV tests became reportable in Florida on 11/20/2006. • As of 2009, all states now have confidential name-based HIV infection reporting.
Reporting Sources of HIV and AIDS Cases • Private MDs • Medical Records • Death Certificates • Laboratories • Medical Examiners • Counseling & • Testing Sites • Correctional Facilities • Hospitals (ICD-9), Billing • HIV Patient Care Clinics • Registries (e.g., AZT, TB, Cancer) Surveillance for HIV/AIDS relies on reporting from the above sources. Additionally, local public health professionals are responsible for case finding and/or epidemiologic follow-up, resulting in a very high completeness of reporting and decent classification of exposure (risk) category.
The Epidemic in Florida Population in 2013: 19.2 million(4th in the nation)Newly diagnosed** HIV infections in 2013: 4,864(2nd in the nation in 2011)Newly diagnosed** AIDS cases in 2013: 2,532(3rd in the nation in 2011)Cumulative pediatric AIDS cases reported through 2013: 1,547 (2nd in the nation in 2011)Persons diagnosed and living***with HIV disease through 2012: 105,627 (3rd in the nation in 2010)HIV prevalence estimate through 2012: 125,000(11.4% of the U.S. estimate for 2010)HIV incidence estimates 2010: 3,454(There was a 30% decrease from 2007-2010) HIV-related deaths in 2012: 923 (Down 8.2% from 2011. The first time to ever be under 1,000 deaths in a given year.) 57% White 15% Black 23% Hispanic 4% Other* 29% White 49% Black 20% Hispanic 2% Other* *Other = Asian/Pacific Islanders; American Indians/Alaskan Natives; multi-racial. **Data by year of diagnosis for 2013 are incomplete and should be interpreted with care *** Living (prevalence) data as of 06/30/2013
Pediatric* HIV Infection Cases and State Population** in Children <13 years of age, by Race/Ethnicity, Reported* through 2013, Florida PopulationEstimates N= 2,870,836 Pediatric HIV Infection Cases N=2,576
Pediatric AIDS Cases by Age Group at Diagnosis and Year of Diagnosis, 1990-2013, Florida N=1,545 These data represent an 90% decline in pediatric AIDS cases by year of diagnosis from 1992 (N=178) to 2013 (N=17). Due to reporting lags, 2013 data by year of diagnosis are provisional. Data as of 03/31/2014.
Perinatally Acquired HIV Infected Cases, Born in Florida, by Year of Birth, 1979-2013 Note: These data represent a 92% decline in HIV-perinatally infected births from 1993 (N=110) to 2013 (N=9). These data include ALL perinatally acquired HIV Infection cases BORN in Florida. 2013 data are provisional. None of the babies born since 2010 have developed AIDS.Data as of 03/31/2014.
Statewide Data: N= 5,938 State Rate = 30.9 Rate per 100,000 population 0 0.1 to 15.0 15.1 to 30.0 > 30.0 HIV Infection Case Rates* by County of Residence,** Reported in 2013, Florida *Population data were provided by Florida CHARTS as of 01/06/2014. **County totals exclude Department of Corrections cases (N=108). Numbers on counties are cases reported.
Statewide Data: N=3,282 State Rate = 17.1 Rate per 100,000 Population 0 0.1 to 15.0 15.1 to 30.0 > 30.0 AIDS Case Rates* by County of Residence,** Reported in 2013, Florida *Population data provided by Florida CHARTS as of 01/06/2014. **County totals exclude Department of Corrections cases (N=66). Numbers on counties are cases reported.
Florida Areas Area 1 Escambia Okaloosa Santa Rosa Walton 3 HOLMES JACKSON WALTON OKALOOSA ESCAMBIA SANTA ROSA WS GD NASSAU HM JF MD CN LEON DUVAL LIBERTY BAY BK 1 SW CB 4 WK TAYLOR Area 2a Bay Calhoun Gulf Holmes Jackson Washington ST JOHNS GF LF BF CLAY FK 2 Area 2b Franklin Gadsden Jackson Jefferson Leon Liberty Madison Taylor Wakulla AL GC DIXIE PT FG 12 LEVY Area 7 Brevard Orange Osceola Seminole MARION VL 13 CT ST Area 3 Alachua Bradford Columbia Dixie Gilchrest Hamilton Lafayette Levy Putnam Suwannee Union LAKE SM HN Area 6 Hernando Hillsborough Manatee ORANGE 7 PASCO BREVARD OSCEOLA Area 4 Baker Clay Duval Nassau St Johns 5 HB POLK Area 5 Pasco Pinellas PN 14 IR 15 HR MA 6 OB ST LUCIE HG Area 11a Dade SS DESOTO MARTIN CHARLOTTE GLADES Area 8 Charlotte DeSoto Glades Sarasota Hendry Collier Lee Area 9 Palm Beach 9 PALM BEACH HENDRY LEE Area 11b Monroe Area 10 Broward 10 8 BROWARD COLLIER Area 14 Hardee Highlands Polk Area 15 Indian River Martin Okeechobee St Lucie Area 13 Citrus Lake Marion Sumter DADE 11 MONROE Area 12 Flagler Volusia
Adult HIV Infection Cases and Population* by Area, Reported in 2013, Florida *Source: Population estimates are provided by FloridaCHARTS
Adult AIDS Cases and Population* by Area, Reported in 2013, Florida *Source: Population estimates are provided by FloridaCHARTS
HIV Infection Cases and Rates*, by Year of Report, 2004-2013, Florida Note: Enhanced laboratory reporting (ELR) laws in 2006 and the expansion of ELR in 2007 led to an artificial peak in newly reported cases of HIV infection in 2008. This was followed by a general decline in reported cases through 2012. Another surge in the expansion of ELR in 2012 was followed by another increase in newly reported cases of HIV infection in 2013. These trends were observed across most race/sex/risk groups throughout the state. *Source: Population estimates are provided by Florida CHARTS as of 01/06/2014.
AIDS Cases and Rates*, by Year of Report, 2004-2013, Florida Note: Enhanced laboratory reporting (ELR) laws in 2006 and the expansion of ELR in 2007 led to an artificial peak in newly reported cases of AIDS in 2008. This was followed by a general decline in reported cases through 2012. Another surge in the expansion of ELR in 2012 was followed by another increase in newly reported cases of AIDS in 2013. These trends were observed across most race/sex/risk groups throughout the state. *Source: Population estimates are provided by Florida CHARTS as of 01/06/2014.
Proportion of Adult HIV Infection Cases, by Sex and Year of Report, 2004-2013, Florida M:F Ratio 2004 2.3:1 2013 3.3:1 Proportion of Cases Note: In 2013, 77% of the adult HIV infection cases were male, compared to only 70% in 2004. Over the past ten years, the proportion of HIV infection cases among men has increased while the proportion among women has decreased. The result is an increase in the male-to-female ratio, from 2.3:1 in 2004 to 3.3:1 in 2013. The relative increase in male HIV cases might be attributed to proportional increases in HIV transmission among men who have sex with men (MSM).
Proportion of Adult AIDS Cases, by Sex and Year of Report, 2004-2013, Florida M:F Ratio 2004 2.3:1 2013 2.5:1 Proportion of Cases Note: Although the proportion of adult AIDS cases among men and women has remained fairly level, the proportion of male AIDS cases increased from 69% in 2004 to 71% in 2013. As the proportion of males increase, the ratio of males-to-females increases as well, thus the male-to-female ratio inclined slightly from 2.3:1 in 2004 to 2.5:1 in 2013.
Adult HIV Infection Cases, by Sex, Reported in the United States* and Florida U.S., 2011 N=49,273 Florida, 2013 N=5,916 Note: Florida has a higher proportion of female cases reported in the most recent year, compared to the U.S. *Source: U.S. data, CDC HIV surveillance report, Vol. 23, Table 1a, 2012 data not available. HIV cases are estimated reports for all 50 states with confidential HIV reporting.
Adult AIDS Cases by Sex, Reported in the United States* and Florida U.S., 2011 N=32,052 Florida, 2013 N=3,279 Note: Florida has a higher proportion of female cases reported in the most recent year, compared to the U.S. *Source: U.S. data, CDC HIV surveillance report, Vol. 23, Table 2a, 2012 data not available.
Adult HIV Infection and AIDS Cases, by Sex, Reported in 2013, Florida HIV Infection N=5,916 AIDS N=3,279 Note: In 2013, a larger proportion of AIDS cases were reported among women compared to the proportion of HIV infection reported among women.
Underlying FactorsAffecting HIV/AIDS Disparities - Amount of HIV already in the community • Late diagnosis of HIV or AIDS* • Access to/acceptance of care* • Stigma, denial*, • Discrimination, homophobia* • HIV/AIDS complacency* • Poverty and unemployment *Factors that HIV/AIDS initiatives can impact.
Adult HIV Infection Cases, by Race/Ethnicity, and Year of Report, 2004–2013, Florida Black Other* White Hispanic Number of Cases Note: Over the past ten years, HIV infection cases decreased among blacks by 32% and among whites by 21%. There was a 1% overall increase among Hispanics for this same period. *Other includes American Indian/Alaska Native, Asian/Pacific Islander, and multi-racial.
Proportion of Adult HIV Infection Cases, by Race/Ethnicity, and Year of Report, 2004-2013, Florida Black Other* White Hispanic Proportion of Cases Note: From 2004 to 2013, the proportion of adult HIV cases among blacks decreased by 6 percentage points. In contrast, increases were observed among both whites (1 percentage point) and Hispanics (6 percentage points) over this same time period.
Adult Male HIV Infection Cases, by Race/Ethnicity, and Year of Report, 2004–2013, Florida Black Other* White Hispanic Percent of Cases Note: Over the past ten years, black men represented the highest proportion (> 35%) of male HIV infection cases by race/ethnicity. From 2004 to 2013, the percentage of male HIV cases increased among Hispanics by 7 percentage points. In contrast, the HIV cases decreased by 1 percentage point among whites and 5 percentage points among blacks over the same time period. *Other includes American Indian/Alaska Native, Asian/Pacific Islander, and multi-racial.
Adult Female HIV Infection Cases, by Race/Ethnicity, and Year of Report, 2004–2013, Florida Other* Black White Percent of Cases Hispanic Note: HIV case disparities are more evident among women than men. For the past ten years, black women represented over 63% of the cases each year. From 2004 to 2013, the proportion of cases by race/ethnicity among women remained fairly stable. *Other includes American Indian/Alaska Native, Asian/Pacific Islander, and multi-racial.
Adult AIDS Cases, by Race/Ethnicity, and Year of Report, 1990–2013, Florida Other* White Black Number of Cases Hispanic Note: This 22 year trend shows the change in the epidemic over time. The peak in AIDS cases in 1993 can be associated with the expansion of the AIDS surveillance case definition. The overall declines in new AIDS cases among all race/ethnic groups are due in part to the success of highly active antiretroviral therapies, introduced in 1996. *Other includes American Indian/Alaska Native, Asian/Pacific Islander, and multi-racial.
Adult AIDS Cases, by Race/Ethnicity, and Year of Report, 2004–2013, Florida Other* Black White Number of Cases Hispanic Note: The overall declines in new AIDS cases among all race/ethnic groups are due in part to the success of highly active antiretroviral therapies, introduced in 1996. From 2004 to 2013, the proportion of adult AIDS cases decreased by 42% among whites, 41% among blacks and 26% among Hispanics. *Other includes American Indian/Alaska Native, Asian/Pacific Islander, and multi-racial.
Proportion of Adult AIDS Cases, by Race/Ethnicity, and Year of Report, 2004–2013, Florida Other* Black White Proportion of Cases Hispanic Note: Historically, blacks account for over 50% of the reported AIDS cases each year. Of the adult AIDS cases reported in 2013, 26% were white, compared to 51% black and 21% Hispanic. Over the past 10 years, the proportion of AIDS cases has remained fairly level among all race/ethnic groups. *Other includes American Indian/Alaska Native, Asian/Pacific Islander, and multi-racial.
Proportion of Adult Male AIDS Cases, by Race/Ethnicity, and Year of Report, 2004-2013, Florida Other* Black White Proportion of Cases Hispanic Note: For most of the past 10 years, black males accounted for nearly 50% of all AIDS cases among men. Over the past ten years, the proportion of adult male AIDS cases decreased among whites (2 percentage points) and blacks (1 percentage point), yet increased among Hispanics (4 percentage points). From 2004 to 2013, the proportion of adult male AIDS cases remained fairly level among the other race/ethnicity group. *Other includes American Indian/Alaska Native, Asian/Pacific Islander, and multi-racial.
Proportion of Adult Female AIDS Cases, by Race/Ethnicity, and Year of Report, 2004–2013, Florida Black White Other* Hispanic Note: AIDS case disparities are more evident among women than men. From 2004 to 2013, black women represented 70% or more of the female AIDS cases for most of the years. *Other includes American Indian/Alaska Native, Asian/Pacific Islander, and multi-racial.
White Black Hispanic Other* Total HIV and AIDS Cases Diagnosed in 2011 and Population, by Race/Ethnicity, United States* 2011 U.S. Population DataN=311,587,816 HIV**N=49,273 AIDSN=32,052 Note: In 2011, blacks are over-represented among the HIV and AIDS cases, accounting for 47% of HIV cases and 50% of AIDS cases, but only 13% of the population. Similarly, Hispanics represent 17% of the population and account for 21% of the HIV cases and 20% of the AIDS cases. All displayed data are estimates. Estimated numbers resulted from statistical adjustment that accounted for reporting delays, but not for incomplete reporting. *Source: U.S. data, CDC HIV surveillance report, Vol. 23, Tables 1a & 2a, 2012 data not available, **HIV infection data are estimated reports from all 50 states with confidential name-based HIV infection reporting.***Other includes Asian/Pacific Islanders, Native Alaskans/American Indians and mixed races.
White Black Hispanic Other* Adult HIV Infection and AIDS Cases Reported in 2013 and Population, by Race/Ethnicity, Florida 2013 Florida* Population EstimatesN=16,344,612 HIVN=5,916 AIDSN=3,279 Note: Blacks comprise only 15% of the adult population in Florida, but represent 43% of adult HIV infection cases and 51% of adult AIDS cases reported in 2013. Hispanics comprise 22% of Florida’s adult population, yet account for 26% of the HIV infection cases and 21% of the AIDS cases. *Source: Population estimates are provided by Florida CHARTS as of 02/05/2014. **Other includes Asian/Pacific Islanders, Native Alaskans/American Indians and mixed races.
White Black Hispanic Other* Adult HIV Infection Cases, by Sex and Race/Ethnicity, Reported in 2013, Florida Males N=4,542 Females N=1,374 Note: In this snapshot of 2013, HIV cases by race/ethnicity among males is more evenly split compared to HIV cases among females where blacks are over-represented, accounting for 66% of adult cases among women. *Other includes Asian/Pacific Islanders, Native Alaskans/American Indians and mixed races
White Black Hispanic Other* Adult AIDS Cases, by Sex and Race/Ethnicity, Reported in 2013, Florida Males N=2,336 Females N=943 Note: In this snapshot of 2013, blacks are over-represented among the AIDS cases, accounting for 44% of adult cases among men and 69% of the adult cases among women. *Other includes Asian/Pacific Islanders, Native Alaskans/American Indians and mixed races
THE FORMULA USED FOR CALCULATING THE RATE IS: • A specific example, using Florida AIDS data: • Number of AIDS Cases Reported in 1996 X 100,000 = 7,300 X 100,000 • Estimated Population of Florida in 1996 14,000,000 • = 52.1 per 100,000 population • (This is the same rate as 5.21 per 10,000 population or 0.521 per 1,000 or • 0.0521 percent.) • Rates allow direct comparison of the burden of disease on various communities, by taking the population size into account. RATE = Number of cases in a specified time X 100,000 Population at that time
HIV Infection and AIDS Cases and Rates* Among Adult Males by Race/Ethnicity Reported in 2013, Florida HIV rate ratios: Black-to-White – 4.4:1 Hispanic-to-White – 2.2:1 AIDS rate ratios: Black-to-White – 6.1:1 Hispanic-to-White – 2.1:1 *Source: Population estimates are provided by Florida CHARTS as of 02/05/2014.
HIV Infection and AIDS Cases and Rates* Among Adult Females by Race/Ethnicity Reported in 2013, Florida HIV rate ratios: Black-to-White – 15.4:1 Hispanic-to-White – 2.6:1 AIDS rate ratios: Black-to-White – 19.4:1 Hispanic-to-White – 2.6:1 *Source: Population estimates are provided by Florida CHARTS as of 02/05/2014.
Adult HIV Infection Case Rates* by Sex and Race/Ethnicity, Reported in 2013, Florida Rate Ratios: MALES Black:White, 4.4:1 Hispanic:White, 2.2:1 FEMALES Black:White, 15.4:1 Hispanic:White, 2.6:1 Note: Similar to AIDS, black men and, to an even greater extent, black women are over-represented in the HIV epidemic. The HIV case rate for 2013 is nearly 5 times higher among black men than the rate among white men. Among black women, the HIV case rate is 15-fold greater than the rate among white women. Hispanic male and female HIV case rate is higher than the rate among their white counterparts. *Source: Population estimates are provided by Florida CHARTS as of 02/05/2014.
Adult AIDS Case Rates* by Sex and Race/Ethnicity, Reported in 2013, Florida Rate Ratios: MALES Black:White, 6.1:1 Hispanic:White, 2.1:1 FEMALES Black:White, 19.4:1 Hispanic:White, 2.7:1 Note: Black men are over-represented in the HIV epidemic. In 2013, the AIDS case rate among black males is 6 times higher than the rate among white males. Among black females, the AIDS case rate is 19-fold greater than the rate among white females. Both Hispanic male and female case rate is higher than the rate among their white counterparts. *Source: Population estimates are provided by Florida CHARTS as of 02/05/2014.
Adult Cases, by Age Group at Diagnosis, Diagnosed in 2011, United States* HIV Infection** N=49,081 AIDS N=32,037 *Source: CDC HIV surveillance report, Vol. 23, Tables 1a & 2a, 2012 data not available. **HIV cases are for all 50 states with confidential HIV reporting. Note: All displayed data are estimates. Estimated numbers resulted from statistical adjustment that accounted for reporting delays, but not for incomplete reporting.
Age Distribution of Adult HIV Infection Cases Compared with the Age Distribution of Adult AIDS Cases, Reported in 2013, Florida HIV Infection N=5,916 AIDS N=3,279 Note: HIV cases tend to be younger than AIDS cases. The greatest proportion of HIV infection cases reported in 2013 were among those aged 20-29 (26%), followed by those aged 40-49 (25%). Conversely, the largest proportion of AIDS cases reported in 2013 was among persons aged 40-49 (30%), followed by those in the 50 and older age group with 29%.
Adult HIV Infection Cases, by Sex and Age Group at Diagnosis, Reported in 2013, Florida Males N=4,542 Females N=1,374 Note: HIV cases tend to reflect more recent transmission than AIDS cases, and thus present a more current picture of the epidemic. With regard to the age group with the highest percent of HIV infection cases, recent estimates show that among males, 28% of HIV infection cases occur among those in the 20-29 age group, whereas among females, 27% of HIV infection cases occur among those in the 50 and older age group.
Adult AIDS Cases, by Sex and Age Group at Diagnosis, Reported in 2013, Florida Males N=2,336 Females N=943 Note: In 2012, recent estimates show that among males, 30% of HIV infection cases occur among those aged 40-49 and 50+ (respectively for both), whereas among females, 30% of HIV Infection Cases occur among those in the 50+ age group.
Adult HIV Infection Cases, by Age Group at Diagnosis, and Year of Report, 2004–2013, Florida Proportion of Cases Over the past ten years, the proportion of newly reported adult HIV cases has shown increases for both the 20-29 (7 percentage points) and 50+ (7 percentage points) age groups. In contrast, the proportion of newly reported adult HIV cases among those in the 30-39 and 40-49 age groups decreased by 10 and 4 percentage points respectively, over the same time period.
Adult AIDS Cases, by Age Group at Diagnosis, and Year of Report, 2004–2013, Florida Proportion of Cases Over the past ten years, the proportion of newly reported cases has shown increases for both the 20-29 and 50+ age groups. The 20-29 age group increased by 4 percentage points and the 50+ age group increased by 8 percentage points over the past ten years. In contrast, the 30-39 age group decreased by 8 percentage points and the 40-49 age group decreased by 5 percentage points over the past ten years. The 13-19 age group remained relatively level throughout the years.
Definitions of Mode of Exposure Categories • MSM = Men who have sex with men • IDU = Injection Drug Use • MSM/IDU = Men who have sex with men & Injection Drug Use • Heterosexual = Heterosexual contact with person with HIV/AIDS or known HIV risk • OTHER = includes hemophilia, transfusion, perinatal and other pediatric risks and other confirmed risks. • NIR = Cases reported with No Identified Risk • Redistribution of NIRs = This illustrates the effect of statistically assigning (redistributing) the NIRs to recognized exposure (risk) categories by applying the proportions of historically reclassified NIRs to the unresolved NIRs.