Evaluating Bank Performance
Evaluating Bank Performance. Outline A Framework for Evaluating Bank Performance Internal Performance External Performance Presentation of Bank Financial Statements Analyzing Bank Performance with Financial Ratios Profit Ratios Risk Ratios

Evaluating Bank Performance
E N D
Presentation Transcript
Evaluating Bank Performance • Outline • A Framework for Evaluating Bank Performance • Internal Performance • External Performance • Presentation of Bank Financial Statements • Analyzing Bank Performance with Financial Ratios • Profit Ratios • Risk Ratios • Internal Performance Evaluations Based on Economic Profit • RAROC (Risk-Adjusted Return on Capital) • EVA (Economic Value Added)
A Framework for Evaluating Bank Performance • Internal Performance • Bank planning (policy formulation) • Goals, budgets, strategic planning • Technology • Computers, communications, payments • Personnel development • Challenges (personal selling and geographic expansion) • Job satisfaction (training and compensation)
A Framework for Evaluating Bank Performance • External Performance • Market share • Earnings effects • Role of technology • Regulatory compliance • Capital • Lending • Securities • Other • Public confidence • Deposit insurance • Public image
A Framework for Evaluating Bank Performance • Presentation of Bank Financial Statements • Balance sheet (Report of Condition) Assets: cash assets, loans, and securities Liabilities: deposit funds and nondeposit funds Capital: equity capital, subordinated notes and debentures, loan loss reserves • Income Statement (Report of Income) Interest income Noninterest income Interest expenses Noninterest expenses (including provision for loan losses) Net profit
A Framework for Evaluating Bank Performance Table 3.1 Balance Sheet for State Bank ($Thousands) ASSETSDEC. 31, 2000 DEC. 31, 1999 Cash assets $ 9,039 $ 10,522 Interest bearing bank balances 0 1,000 Federal funds sold 10,500 1,500 U.S. Treasury and agency securities 54,082 44,848 Municipal securities 32,789 34,616 All other securities 0 0 Net loans and leases 90,101 81,857 Real estate loans 50,393 38.975 Commercial loans 9,615 11,381 Individual loans 8,824 10,640 Agricultural loans 20,680 19,654 Other loans and leases-domestic 3,684 4,025 Gross loans and leases 93,196 84,675 Less: unearned income reserves 89 282 Reserve for loan and lease losses 3,006 2,356 Premises, fixed assets, and capitalized leases 2,229 2,398 Other real estate 2,282 3,012 Other assets 4,951 4,014 Total assets $205,973 $183,767
A Framework for Evaluating Bank Performance Table 3.1 Balance Sheet for State Bank ($Thousands) LIABILITIES & CAPITAL DEC. 31, 2000 DEC. 31, 2001 Demand deposits $ 23,063 $ 22,528 All NOW and ATS accounts 6,021 5,322 MMDA accounts 41,402 49,797 Other savings deposits 3,097 2,992 Time deposits<$100K 31,707 28,954 Time deposits>$100K 83,009 57,665 Total deposits 188,299 167,258 Fed funds purchase and resale 0 0 Other borrowings 0 0 Bankers’ acceptance and other liabilities 3,546 3,101 Total liabilities 191,845 170,359 Subordinated notes and debentures 0 0 All common and preferred equity 14,128 13,408 Total liabilities and capital $205,973 $183,767
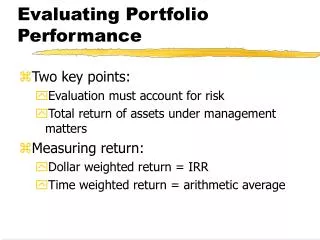
Analyzing Bank Performance with Financial Ratios • Profit ratios • Rate of return on equity • ROE = NI/TE (net income after taxes/total equity) • Rate of return on assets • ROA = NI/TA (net income after taxes/total assets) • Other profit measures • Net interest margin • NIM = (Total interest income - Total interest expense)/Total assets • Note: municipal bond interest is not taxable, such that it must be grossed up to a pre-tax equivalent basis by dividing munis interest earned by the factor (1 - tax rate of bank).
Analyzing Bank Performance with Financial Ratios • Profit ratios • Unraveling profit ratios • ROE = ROA x TA/TE (total assets/total equity or equity multiplier). • Thus, by decreasing equity, a bank can increase ROE based on any given level of ROA. ROE = NI/OR x OR/TA x TA/TE (where OR is operating revenue). The NI/OR ratio is the profit margin, while OR/TA reflects asset utilization. By using this breakdown, one can make inferences concerning the reason for say increases in ROE. If asset utilization and equity multiplier did not change, the profit margin must have increased due to cost savings pushing this ratio up.
Analyzing Bank Performance with Financial Ratios • Risk ratios • Capitalization Leverage ratio Total equity/Total assets Total capital ratio (Total equity + Long-term debt + Reserve for loan losses)/Total assets Note: book values and market values likely are different and yield different results.
Analyzing Bank Performance with Financial Ratios • Risk ratios Asset quality • Provision for loan loss ratio • = PLL/TL (provision for loan losses/total loans and leases) Loan ratio = Net loans/Total assets Loss ratio = Net charge-offs on loans (gross charge-offs minus recoveries)/Total loans and leases Reserve ratio = Reserve for loan losses (reserve for loan losses last year minus gross charge-offs plus PLL and recoveries)/Total loans and leases Nonperforming ratio = Nonperforming assets (nonaccrual loans and restructured loans)/Total loans and leases
Analyzing Bank Performance with Financial Ratios • Risk ratios • Operating efficiency (cost control) Wages and salaries/Total expenses Fixed occupancy expenses/Total expenses • Liquidity Temporary investments ratio = (Fed funds sold, short-term securities, cash, trading account securities)/Total assets Volatile liability dependency ratio = (Total volatile liabilities - Temporary investments)/Net loans and leases Note: This ratio gives an indication of the extent to which “hot” money is being used to fund the riskiest assets of the bank.
Analyzing Bank Performance with Financial Ratios • Other financial ratios • Tax rate = Total taxes paid/Net income before taxes • Dollar gap ratio = Interest rate sensitive assets - Interest-rate sensitive liabilities Total assets where rate-sensitive means short-term with maturities of less than one year (or repriced in less than one year).
Internal Performance Evaluations Based on Economic Profit • RAROC (Risk-adjusted return on capital) • Example Cost of funds 5.00% Provision for loan losses 1.00 Direct expense 0.50 Indirect expense 0.25 Overhead 0.25 Total charges before capital charge 7.00% Capital charge* 2.29 Total required loan rate 9.29% *Note: The capital charge is determined by multiplying the equity capital allocated to the loan times the opportunity cost of equity and then converting to a pre-tax level. Assume that the allocated equity to loan ratio is 10% and the opportunity cost of equity is 16%, such that the after-tax capital charge is 1.6%. If the tax rate for the bank is 0.3, the pre-tax capital charge is 1.6/(1.0-0.3), or 2.29. In this example, if the loan rate is 9.29%, the bank will earn the target return on equity of 16%. Of course, if the bank can price the loan at a rate higher than 9.29%, it will earn profit over the target level of equity returns. In this case an economic profit is earned in that the value of equity is increased.
Internal Performance Evaluations Based on Economic Profit • EVA (Economic value added) = Adjusted earnings – Opportunity cost of capital, where adjusted earnings is net income after taxes, and the opportunity cost of capital equals the cost of equity times equity capital. • RAROC and EVA • Both methods are beneficial in assessing managerial performance and developing incentive compensation schemes compatible with shareholder wealth goals. • RAROC has a short-run perspective (i.e., business unit profit is compared to the unit’s capital at risk) • EVA has a long-run perspective (i.e., business unit profit is compared to the cost of capital of the bank)