OBESITY AS A RISK FACTOR
230 likes | 422 Vues
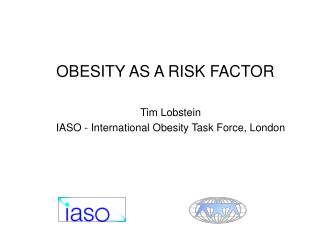
OBESITY AS A RISK FACTOR. Tim Lobstein IASO - International Obesity Task Force, London. BMI distribution moves to the right as population mean rises. Probability density. Body Mass Index (kg/m 2 ). Source : Rose, G. (1991). UK women aged 30-40 1980: mean 24 2005: mean 27. Owt Ob

OBESITY AS A RISK FACTOR
E N D
Presentation Transcript
OBESITY AS A RISK FACTOR Tim Lobstein IASO - International Obesity Task Force, London
BMI distribution moves to the right as population mean rises Probability density Body Mass Index (kg/m2) Source: Rose, G. (1991) . UK women aged 30-40 1980: mean 24 2005: mean 27 Owt Ob 21% 4% 30% 25%
European overweight and obesity adult prevalences (1992-2001) Age-ranges vary but most cover 20+ years. IOTF data for UK.Health Select Ctte. May 2004
Excess weight by age Health Survey of England 2001
Global burden of diseases – % attributable to BMI % 60 40 20 Breast Cancer (Post Menopause) Colon Cancer Heart Disease Stroke Endometrial cancer Hypertension Diabetes Osteo arthritis Source: IOTF/WHO Global Burden of Disease, World Health Report 2002
Odds ratio E Weiderpass et al (2000) CCC, 11.
Relative risk comparing obese (BMI 30+) with normal-weight adults
Relative risks by obesity category Compared with normal-weight adults male female Disease 0-65 65+ 0-65 65+ CHD BMI 25-30 1.35 1.00 1.40 1.00 BMI 30+ 1.80 1.20 2.00 1.25 Stroke BMI 25-30 1.35 1.00 1.25 1.00 BMI 30+ 1.50 1.15 1.60 1.20 Diabetes BMI <24 1.00 1.00 0.80 0.80 … BMI >35 90.00 90.00 42.10 42.10 C - colorectal BMI 25-30 1.15 1.15 1.15 1.15 BMI 30+ 1.33 1.33 1.33 1.33 C - breast BMI 25-30 1.00 1.00 1.00 1.12 BMI 30+ 1.00 1.00 1.00 1.25 C - endometrium BMI 25-30 1.00 1.00 1.59 2.52 UK Foresight 2007.
Increased risk per unit of BMI Risk of developing disease Colorectal cancer 1.03 (1.01-1.05) P-m breast cancer (f) 1.02 (1.02-1.03) Endometrial cancer (f) 1.10 (1.07-1.14) Renal cancer 1.06 (1.05-1.08) IARC/Karolinska 2001
Increased risk per unit of BMI Risk of developing Type 2 diabetes male female age 15-29 na na age 30-44 1.36 1.47 age 45-59 1.24 1.34 age 60-69 1.18 1.21 age 70 + 1.27 1.20 GBD, 2005
Increased risk per unit of BMI Need to update risk indices for full range of diseases of interest Cancer – 6 sites CHD, stroke, diabetes COPD (chr. obstructive pulmonary dis)
Heart disease in adulthood according to BMI in childhood Increased risk according to 1 unit increase in BMI z score Baker et al NEJM 2006
Sources Mean BMI, prevalence data • WHO global database • WHO- Murray and Lopez Global Burden analysis • IOTF adult and child databases Relative risk • Cancer = IARC, Karolinska 2001, Renehan et al 2008 • CHD = Vischer & Rissanen, GBD analyses • Diabetes = IDF, GBD, Danish Nutrition Council • COPD = ???