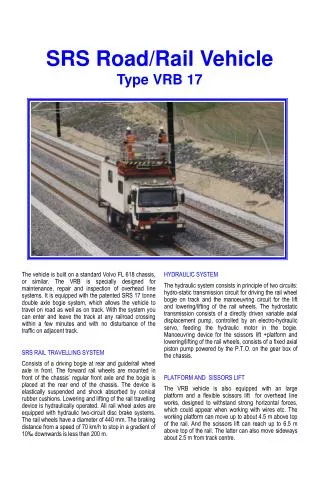
Road Vehicle Performance
Road Vehicle Performance. CEE 320 Anne Goodchild. Outline. Resistance Aerodynamic Rolling Grade Tractive Effort Maximum Tractive Effort Engine Generated Tractive Effort Acceleration Braking Stopping Sight Distance. Review. Force (N): influence that tends to change motion

Road Vehicle Performance
E N D
Presentation Transcript
Road Vehicle Performance CEE 320Anne Goodchild
Outline • Resistance • Aerodynamic • Rolling • Grade • Tractive Effort • Maximum Tractive Effort • Engine Generated Tractive Effort • Acceleration • Braking • Stopping Sight Distance
Review • Force (N): • influence that tends to change motion • mass (kg) * acceleration (m/s2) • Torque (Nm): • infleunce that tends to change rotational motion • Force * lever arm • Work (Nm): • Force * distance • Power (Nm/s): • Rate of doing work (work/time) Unitsmatter!
Resistance (N): Force impeding vehicle motion Tractive Effort (N): Force available at the roadway surface to perform work Primary Opposing Forces
Resistance (N): Force impeding vehicle motion Tractive Effort (N): Force available at the roadway surface to perform work Primary Opposing Forces
Aerodynamic Resistance Ra Composed of: • Turbulent air flow around vehicle body (85%) • Friction of air over vehicle body (12%) • Vehicle component resistance, from radiators and air vents (3%) from National Research Council Canada
Power required to overcome Ra • Power • work/time • force*distance/time • Ra*V
Rolling Resistance Rrl Composed primarily of • Resistance from tire deformation (90%) • Tire penetration and surface compression ( 4%) • Tire slippage and air circulation around wheel ( 6%) • Wide range of factors affect total rolling resistance • Simplifying approximation:
Power required to overcome rolling resistance • On a level surface at maximum speed we could identify available hp
Grade Resistance Rg Composed of • Gravitational force acting on the vehicle • The component parallel to the roadway θg For small angles, Rg θg W G=grade, vertical rise per horizontal distance (generally specified as %)
Available Tractive Effort The minimum of: • Force generated by the engine, Fe • Maximum value that is a function of the vehicle’s weight distribution and road-tire interaction, Fmax
Engine-Generated Tractive Effort • Force
Engine Generated Tractive Effort: Power Pe in kW hPe in hp
Diagram Ra h ma Rrlf h Wf W Fbf θg lf Rrlr lr Wr L Fbr θg
Maximum Tractive Effort • Front Wheel Drive Vehicle • Rear Wheel Drive Vehicle • = coefficient of road adhesion
Vehicle Acceleration • Governing Equation • Mass Factor (accounts for inertia of vehicle’s rotating parts)
Braking • Maximum braking force occurs when the tires are at a point of impending slide. • Function of roadway condition • Function of tire characteristics • Maximum vehicle braking force (Fb max) is • coefficient of road adhesion () multiplied by the vehicle weights normal to the roadway surface
Braking Force • Front axle • Rear axle
Braking Force • Maximum attainable vehicle deceleration is g • Maximum obtained when force distributed as per weight distribution • Brake force ratio is this ratio that acheives maximum braking forces
Braking Force • Ratio • Efficiency We develop this to calculate braking distance – necessary for roadway design
Braking Distance • Theoretical • Assumes effect of speed on coefficient of rolling resistance is constant and calculated for average of initial and ending speed • Ignores air resistance • Minimum stopping distance given braking efficiency • For population of vehicles, what do you assume about rolling resistance, coefficient of adhesion, and braking efficiency?
Braking Distance • Practical • For 0 grade typically assume a = 11.2 ft/sec2
Response time • Perception time • Total stopping distance
Stopping Sight Distance (SSD) • Worst-case conditions • Poor driver skills • Low braking efficiency • Wet pavement • Perception-reaction time = 2.5 seconds • Equation
Stopping Sight Distance (SSD) from ASSHTO APolicy on Geometric Design of Highways and Streets, 2004 Note: this table assumes level grade (G = 0)