Risk-Based, Probabilistic Cost Estimating Methods
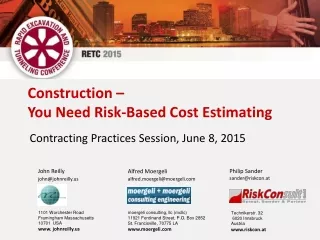
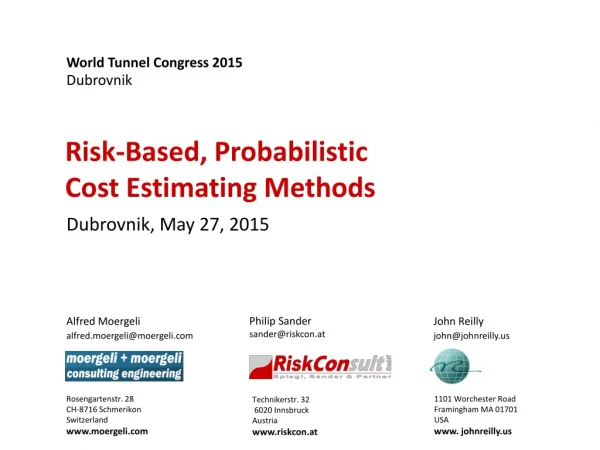
World Tunnel Congress 2015. Dubrovnik. Dubrovnik, May 27, 2015. Risk-Based, Probabilistic Cost Estimating Methods. Philip Sander sander@riskcon.at. Alfred Moergeli alfred.moergeli@moergeli.com. John Reilly john@johnreilly.us.

Risk-Based, Probabilistic Cost Estimating Methods
E N D
Presentation Transcript
World Tunnel Congress 2015 Dubrovnik Dubrovnik, May 27, 2015 Risk-Based, ProbabilisticCost Estimating Methods Philip Sandersander@riskcon.at • Alfred Moergelialfred.moergeli@moergeli.com • John Reillyjohn@johnreilly.us Rosengartenstr. 28 CH-8716 SchmerikonSwitzerlandwww.moergeli.com 1101 Worchester RoadFramingham MA 01701 USAwww. johnreilly.us Technikerstr. 32 6020 Innsbruck Austria www.riskcon.at
Overview • Target – What will youlearnhere & today? • Current Status – Cost & Time Overrunsdominate the news … • OverviewofexistingCostEstimatingMethods • ComparisonofexistingCostEstimatingMethods • IncludeYourRisks • How do you do this? • YourLessonsLearned • Questions / Answers
WhatYou Will LearnHere & Today Here & now, you will learn, howto… Avoidunderestimatingyourcost (& time)=> Nowrongpromises IncludeyourRisks(= EffectsofUncertainties on your Goals) transparently, DeliverCostEstimateswithprobabilityinformation => DeliverreliableCostEstimates …=> Andcommunicateyourresultsaccordingly! This will changeyourapproachtocostestimatesfor the restofyourlife. Welcome - greattohaveyou all here!
Section 2Current Status - Endless Cost & Time Overruns dominate the news …
Do YouHaveSimilar Projects … Experience? Sydney Opera House, NSW, Australia Started: 1957 Completed: 1971 (14 years) Budget: AUS 7 Million (= 100 %) Cost @ Completion: AUS 102 Mio (1’457 %) Source: http://www.eoi.es/blogs/cristinagarcia-ochoa/2012/01/14/the-sidney-opera-house-construction-a-case-of-project-management-failure/ Elbe Philharmony, Hamburg, HH, Germany Started: 2007 (- 2010) Completed: … ? (Expectedfor 2017) Bugdet: EUR 241 Million (= 100 %) Cost @ Completion: … ? (Expected in 2015: EUR 865 Million = 359 %) Source: http://www.spiegel.de/international/business/disastrous-public-works-projects-in-germany-a-876856.html Source: NZZ, May 21, 295 Berlin-Brandenburg Airport (BER), Berlin, GermanyStarted: 2006 (- 2008) Completed: … ? (Maybe in 2017 …) Budget: EUR 2 Billion (= 100 %) Cost @ Completion: … ? (Expected in 2015: EUR > 5.4 Billion = 270 %) Source: http://www.spiegel.de/international/business/disastrous-public-works-projects-in-germany-a-876856.html Source: NZZ, May 21, 295
Why … What May Be the Root Causesfor Project Management Desasters? Potential Root Causes– Author’sUsualSuspects … Politics …?“ … We must not create false expectations …”(German Chancellor Angela Merkel, speaking in front of the Berlin parliament before leaving for the Eastern Partnership Summit in Riga last Thursday, May 21 – Author’s quote)“ … Youmust not makepromisesyoucannotkeepupwith…”(Werner Fayman, Austrian Federal Chancellor, recentlyspeaking, Author’squote) Loss ofcommunication Other? – Yes, forsure … Our current, existing Cost Estimating Methods …?=> Optimistically biased …=> No Value at Risk (VaR) information available
Value at Risk (VaR) Definition Value at Risk (VaR)= A certain amount, within a distribution,that will not be exceeded according to the corresponding probability. VaR 70 means that a $5M budget would not be exceeded in 70%of all simulated scenarios(there remains a 30% probabilitythat the $5M budget will be exceeded)
Overviewof Well-Known, EstablishedCostEstimatingMethods Basically there 4 types of existing, well-known Cost Estimating Methods: Deterministic:Aggregated unit quantities multiplied by unit prices.Usually with some degree of conservatism built in.Plus an added reserve or contingency Bandwidth:Range approach with minimum, most likely, and maximum cost.The total cost is obtained by simply adding these parameters for all line items. Square Root:Delivers one single figure which is the sum of all base costs plus the square root of the sum of the squares of the risk contingencies. Probabilistic:Range approach which characterizes cost informationwith probability distributions
Bandwidth (Method 2) versus Probabilistic (Method 4) Approach: Basics Bandwidth Approach Probabilistic Approach • Input: • 3-Point-Estimate • Process: • Simply adding up the minimum, most likely and maximum values from each item • Suggests that the extreme scenarios will have the same occurrence rateas scenarios around the most likely value. • This will lead to scenarios which will not occur in reality • Input: • 3-Point-Estimate modelling a distribution density • Process: • Simulation (e.g. Monte Carlo Simulation) to cover most of real risk combinations • Will lead to a realistic result where best and worst case scenarios are adequately considered min min min min min mostlikely (ml) ml ml ml ml max max max max max Example: Triangle Distribution + + + Aggregation
Bandwidth (Method 2) versus Probabilistic (Method 4) Approach: E.g. Rolling 20 Dice • Input: One Die • Same probability of every value between 1 and 6 • Same input for both methods • Simple 2-Point-Estimate Rolling 20 dice – Consider this to be 20 risks in a project 1 20 6 120 Bandwidth Approach Probabilistic Approach Result (Reality) • Result • Bandwidth from 20 to 120 • Same probability for every scenario • Many more combinations than rolling 1 die • Not a realistic scenario:120 (20 x 6 -only one possible combination) is equal rated to e.g. 70 where many combinations will lead to the same result • Even higher effect when using 3-Point-Estimates • No probability information • Not applicable for cost prediction • Maximum around 95 instead of 120. 120 will not occur even using 100’000 iterations • Same for minimum • The most likely scenario will be around 70
Square Root Approach (Method 3) Standard Cost Estimation Items Square Root Method is used to adapt the risk contingency in order to consider that all risks won't occur at the same time. • Delivers no realistic result • Simple deterministic (one figure) surcharge • Information on the individual item is lost (not valid in comparison to overall result) • No probability information • No Value at Risk (VaR) information,e.g. how much is risk covered by budget New overall risk contingency
Square Root Approach (Method 3) for Quantitative Risk Assessment Risk Assessment Using Bandwidths New overall contingency min min max Again … keep in mind that not all risks will occur at the same time Result max = 77,000 min =35,000 60,962= 35,000 + 25,962 Bandwidth information is lost
All Four Cost Estimating Methods in Comparison: Tunnel Excavation Category (Base Cost only) 1. Deterministic Approach 2. Bandwidth Approach Most likely quantity x most likely price 306.95 USD 223.36 USD 306.95 USD 453.86 USD 4. Probabilistic Approach 3. Square Root Approach = 375.67 USD
All Four Cost Estimating Methods in Comparison: Visualized Probabilistic Approach Square Root Approach Deterministic Approach Bandwidth Approach C A B D Ml. Max. Min. VaR5 VaR50 VaR95 223 286 376 321 307 362 454 B D C D D B B 307 A
All Four Cost Estimating Methods in Comparison: Pro’s & Con’s
Section 5 IncludeYourRisks
Control YourUncertainty– DistinguishBetween Basic Elements andRisks Will always occur(e.g. elements in a cost estimation) Exact price or time is uncertain • Has a probability of occurrence • Consequences (costs, time, etc.) are uncertain
Basic Travel Time from Your Home to Dubrovnik Your Home DubrovnikSource: Author‘s Picture Estimation of the basic driving time from your City to Dubrovnik Premise: Normal traffic and weather conditions Basic Travel Time Worst case: 5 h Best case: 3.5 h Most likely: 4 h
Add a Risk – Bad Weather DubrovnikSource: Author‘s Picture Your Home Risk: Bad weather in … • Snow and icy roads / Thunderstorms / … [You name it] • Scenario has a probability of occurrence – can occur but does not have to • Estimated probability: 45 % • Additional time is needed (= impact if risk does occur) Impact/Consequences Worst case: 2.5 h Best case: 0.5 h Most likely: 1 h
Act As Your Own Risk Manager – Plan For Controls Plan for Controls: • How important is your attending the ITA/WTC in Dubrovnik on time? • Can you afford being (too) late? • Cover the risk of coming in late Plan for Controls - Start earlier or not …? Cover 100%plan 7.5 h Cover 80%plan 5.5 h Cover 10%plan 3.8 h
Aggregating All Your Cost Components Determine Your Budget Create a budget for each cost component or for the total costs. How much of the cost potential do you want to cover? Say 70% Budget: 37.2 Mio Peaks caused by probability of single risks mitigate
How Do You Do This? You will need Software. Whiletherearesome commerciallyavailable packages, werecommendtouse RIAATRisk Administration & Analysis Tool => http://riaat.riskcon.at/ English Version Top Advantages: Project Structure Full excel Import & Export Strong Visualizations …
Section 7 YourLessonsLearned – Here & Today
YourLessonsLearned – Here & Today Avoidsinglefigure, deterministicestimates Identify & includeyour Base Cost& yourRisks UseThree-Point-Estimatesforquantities & price Aggegate all costitemsprobabilistically Choose a Value @ Risk (VaR) on the safeside Just startwithit … now! Control yourrisks (uncertainties) beforetheycontrolyou! Youare not alone– wearereadytohelp
Where is Your Project on This Curve?How Do You Know …? 85% Value at Risk (VaR) = a certain amount, within a distribution,that will not be exceeded according to the corresponding probability. … By Your Next Estimate on a Risk-Based Approach
World Tunnel Congress 2015 Dubrovnik - May 27, 2015 Section 8 - Your Questions … Our Answers - Thankyou! Presentation: Readyforyourdownloadfromourwebsites soon(next week) Risk-Based, Probabilistic Cost Estimating Methods Philip Sandersander@riskcon.at • Alfred Moergelialfred.moergeli@moergeli.com • John Reillyjohn@johnreilly.us Rosengartenstr. 28 CH-8716 SchmerikonSwitzerlandwww.moergeli.com 1101 Worchester RoadFramingham MA 10701 USAwww. johnreilly.us Technikerstr. 32 6020 Innsbruck Austria www.riskcon.at