Download
1 / 26
260 likes | 272 Vues
This report highlights the critical service gaps in the FY09 CSA program, including statewide and regional trends, historical service needs, and changes in community service capacity.

E N D
FY09 CSA Critical Service Gaps Office of Comprehensive Services January 29, 2010
FY09 CSA Critical Service Gaps • Highlights of FY09 critical service gaps survey • Overview of service gaps survey • Statewide service gaps • Historical trends of services needs • FY09 regional differences • Historical trends of barriers • Changes in community service capacity
FY09 Critical Service Gaps Highlights • Serving youth with more severe needs in community settings is reflected by increasing gaps reported for: • crisis services, family services and outpatient behavioral health services • Crisis intervention remains the most highly reported critical need • Intensive substance abuse services continues as a prominent need for Western, Central and Northern regions • Congregate care continues to decline in the rankings • A third of localities surveyed report some decreases in services for: • emergency shelter care, medications management, group homes and substance abuse services • Over 80% of localities report new community based services
Overview of Service Gaps Survey • One of the primary responsibilities of the Community Policy and Management Team (CPMT) is to coordinate long range, community-wide planning to develop resources and services needed by children and families in the community (§2.2-5206). • The 2006 Virginia General Assembly amended Chapter 781 of the Code of Virginia to further specify this requirement. On an annual basis, the CPMT shall report to the Office of Comprehensives Services (OCS) on gaps and barriers in services needed to keep children in the local community (§2.2-5211.1). • This report reflects the third year that this data has been collected by OCS on the service gaps and barriers for CSA youth in Virginia.
Overview of Service Gaps Survey • Lack of local services may result in placements outside of the community that can negatively affect child outcomes and increase costs. Service gaps may also delay some children’s return to the community. • By completing an annual survey of critical service gaps, CPMTs may use this data to guide local initiatives to develop and strengthen specific community services, justify local needs for grants, encourage regional collaboration and attract new providers. • State decision makers will have access to data on the most critical service needs across the Commonwealth.
Overview of Service Gaps Survey • In FY06, JLARC conducted the original survey of local service gaps utilizing a template of services provided by SAMHSA. • For the past three years, localities were asked to rank their top 5 service gaps from the same list of services from previous surveys. They were asked to indicate from a list of barriers, which ones were impacting their ability to develop community based services. • Members of the State Executive Council have also provided input in expanding the response items to include data on increases and decreases in services capacity and the use of natural supports.
Overview of Service Gaps Survey • The response rate for local CSA programs participating in the survey has increased over time:
FY09 Statewide Service Gaps Top 20 Service Gaps Ranked by CSA Census* 1 Crisis Intervention and Stabilization 11 After School Recreational 2 Intensive Substance Abuse Services 12 Alternative Ed Day Programs 3 Emergency Shelter Care 13 Supervised Ind. Living 4 Acute Psychiatric Hospitalization 14 Substance Abuse Prevention 5 Regular Foster Care/Family Care 15 Child & Family Advocacy 6 Parenting/Family Skills Training 16 Parent & Family Mentoring 7 Transportation 17 Short-term Diag. Assess 8 Psychiatric Assessment 18 Developmental Prevention 9 Respite 19 Wraparound Services 10 Family Assessment 20 Special Populations Housing *Individual locality reports weighted by local CSA census.
Historical Trends of Service Needs:Crisis Services • Crisis intervention and respite continue in the top rankings; the reported need for shelter care and acute hospitalization has risen.
Historical Trends of Service Needs:Crisis Services • Need for crisis intervention services continues to be reported at a plateau above other top ten gaps.
Historical Trends of Service Needs:Family Services • Seven family support and related services have remained in the top twenty gaps over the past three years.
Historical Trends of Service Needs:Outpatient Behavioral Health Services • Need for two substance abuse services feature prominently within the top twenty statewide gaps.
Historical Trends of Service Needs:Outpatient Behavioral Health Services • Regional reports for substance abuse services indicate increased needs for central, northern and western areas.
Historical Trends of Service Needs:Assessment and Diagnosis • Three assessment and diagnostic services continue to represent prominent gaps in the services continuum:
Historical Trends of Service Needs:Congregate Care Services • Reported gaps in congregate care services continue to decline. • This reflects changes in CSA Data Set utilization of congregate care. • FY09 3,697 youth • FY08 4,313 youth • FY07 4,301 youth
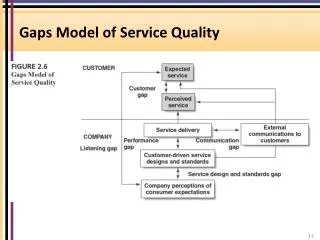
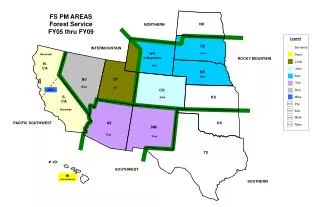
CSA Data Set Reporting Regions Yellow Areas – Central Region Blue Areas – Northern Region Green Areas – Piedmont Region White Areas – Western Region Red Areas – Eastern Region
FY09 Regional Differences • Top service gaps ranked by frequency
FY09 Regional Differences • Around 70% of the service needs reported in regional surveys are consistent with the present statewide profile of top twenty gaps. • Some 2009 differences from the statewide profile of gaps include: • Central: Intensive In-home Services • Eastern: Attendance Support • Northern: Career Technical and Vocational Education • Piedmont: Planned Respite • Western: Substance Abuse Day Treatment • Smaller and rural localities have more reported gaps for: • Life Skills Training • Intensive In-Home Services • Medication follow-up/Psychiatric Review
Statewide Barriers Top Barriers to Community Service Availability: 2007 through 2009 • Require access to grant or flexible funding for program start up • Need to pool resources and funding across multiple community partners and funding sources • Need to demonstrate the need for and value of service to local decision makers • Need for greater collaboration among community stakeholders • Community leaders have not reached consensus on prioritizing development of this service
Changes in community services capacityCommunity Planning • CPMT planning to develop community services:
Changes in community services capacityServices Increases • State and regional reported increases in community services:
Changes in community services capacityServices Increases • From the anecdotally reported new community services described in last year’s FY08 survey, the most commonly reported services included: • School-based Mental Health Day Treatment • Parent and Family Mentoring • Parent/Family Skills Training • Wraparound Services • Intensive In-home Services • As a result of local needs and changes in the match rates, the most commonly reported new services from the FY09 survey include: • Therapeutic Foster Care services • School based Mental Health Day Treatment • Intensive In-home Services • Regular Foster Care/Family Care services • Intensive Care Coordinator services
Changes in community services capacityServices Decreases • State and regional reported decreases in any services for youth:
Changes in community services capacityNatural Supports • State and regional reports on the use of natural supports • Within the context of the family engagement initiative and declining financial resources, the following item was added:
Changes in community services capacityReported local examples of developing services • Assessment and Diagnosis • Engaged private provider to expand short term diagnostic services • Crisis Services • Worked with TFC agency to provide respite for foster care prevention • CSB led initiative brought new crisis providers to area • Family Services • Cooperative Extension Office providing new parenting classes • Recruited new private agency to community for in-home services • Increased nearby foster homes through local dept. of social services • Outpatient Behavioral Health • CSB recently restored drug screening program • Family Drug Treatment Court developed new SA services with CSB • Private provider started new group therapy for sex offenders • Local hospital expanded outpatient psychiatric services
Changes in community services capacity Regional and state strategies for developing services • Regional CPMT groups have met in multiple parts of the state to: • Evaluate regional needs and contact vendors for potential new services • Share best practices of new services developed • Community Services Board has utilized a regional RFP approach to: • Develop new community services vendors in their catchment area • Negotiate rates on behalf of the CPMTs seeking services • Central Region is planning a services development workshop to: • Frame regional data and service development issues • Bring together CPMTs and private providers to begin discussions • State level data reports from the previous service gaps surveys • Will be analyzed, converted to user friendly format and publicly distributed