Download
1 / 48
480 likes | 523 Vues
Discover how Cisco WAAS aligns with CIO budget priorities, addresses buyer pain points, and delivers ROI through improved application performance and server consolidation. Gain insights from real-world success stories.

E N D
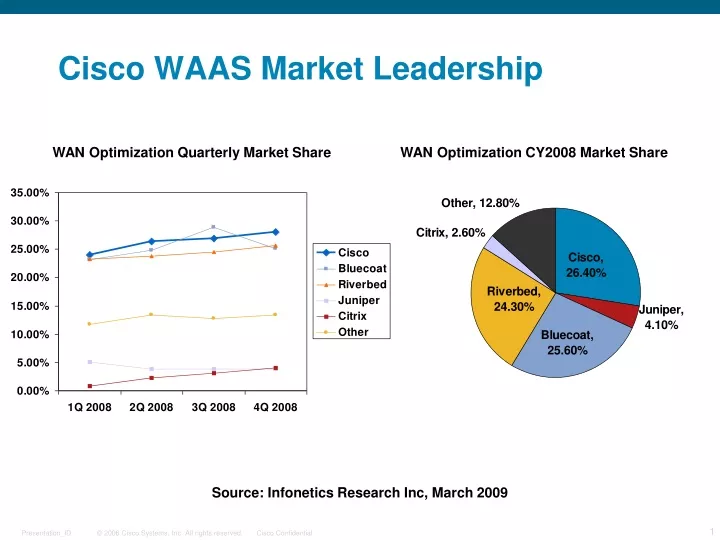
Cisco WAAS Market Leadership WAN Optimization Quarterly Market Share WAN Optimization CY2008 Market Share Source: Infonetics Research Inc, March 2009
Identifying and winning WAAS Opportunities March 2009 FENG MENG Product Marketing Manager Data Center Solution
Key Topics • Match WAAS with CIO budget priorities • Identify buyer pain points • Present prescriptive solutions • Demonstrate ROI
What Are CIO Budget Priorities? Source: Goldman Sachs IT Spending Priority Survey, January 2009 Among 100 IT Managers with Strategic Decision-Making Authority from Fortune 1000 Companies
Why WAN Optimization Ranks So High? • WAN limitations contributed to server & storage sprawl • Server/storage centralization & virtualization left users behind • Most users work remotely • Poor application performance – low productivity • Costly bandwidth upgrades didn’t help • WAN optimization enables server & storage consolidation and virtualization while maintaining LAN-like performance
Match WAAS with CIO Budget Priorities 2 3 4 50%+ Servers Still Deployed Outside Data Center WAAS: Enables Server Consolidation & Virtualization 1 50% Servers Still Have Internal Storage WAAS: Helps Storage Consolidation & Data Protection Application Performance WAAS: Improves Employees Productivity WAN and Router Refresh WAAS: Reduces Branch IT Cost of Ownership
Chief Information Office (CIO) VP Application Services VP Operations Director Collaboration Software Architecture Group Director ERP Software Director,Infrastructure Services Director,Data Services DirectorSupport Services Director CRM Software ManagerServer Operations ManagerDatabase Operations ManagerHelp Desk DirectorHR Software ManagerStorage Operations ManagerRisk & Compliance ManagerSLA Monitoring Manager, Network & Security Operations Manager, Data Life Cycle Management ManagerDesktop Management ManagerData Center Facilities Target Server Decision Makers
Server Buyer Pain Points 50% servers still deployed outside data centers in 2008 1 Average branch server utilization: 15% Average data center server utilization: 70% 2 Branch servers have high TCO because • No virtualization & economies of scale • Major CapEx: Server refresh every 3 years, truck roll/site • Major OpEx: Monthly patch management, help desk support 1: Microsoft, IDC 2008, 2: IDC Server Tracker, August, 2008
Branch Server Consolidation Solution • Application acceleration: Consolidates most branch servers while maintaining LAN-like application performance • Windows Server on WAAS: Hosts locally-required services without physical server footprint • Virtualized services: Improves agility by provisioning services in software Branch offices without WAAS Branch offices optimized by WAAS Backup Storage Cisco WAAS Servers Users Users Router Router
Demonstrate ROIFile/Print/Email Server Consolidation Story Challenges: • Large oil & gas drilling/services company • 20 branches with file/print/mail servers. • Branch servers end of 3-year life • Facing a $35k/site server refresh CapEx Solution: • Centralized file/print/mail • Application acceleration embedded in router Results: • Decommissioned branch servers & storage • CapEx savings/site: $28,000 • OpEx savings/site: $7,200 per year • “With WAAS, the overall costs per site were reduced from: • $35k to $7k one time; • $700/month to $100/month” • - Kirk Reid: IT Director, Precision Drilling: http://www.networkworld.com/community/node/28002?page=1
Demonstrate ROIWindows Server Virtualization Story Local Windows print and DHCP Protected against WAN outage Challenges: • 63 remote locations, each with servers: File Server; most have AD, DHCP & Print • Finance users: SAP for booking orders • Sales/mktg users: File & MS office • Customer service users: • Development & support application • Download phone OS & apps images from central location • Constantly adding BW, storage & memory Solution: • Windows Sever remains in branch but moved from physical servers to network appliances for a low cost/complexity footprint Results over the next 3 years: • Existing server refresh avoidance: Saves 16K Euro • New server CapEx avoidance:12K Euro • 5K Euro for box, 5K Euro for install • 2K Euro for memory and storage upgrades • New server OpEx avoidance: 4.2K Euro • 1K Euro for 3 year support contract • 1.6K Euro per year remote and on-site management See detailed case study: http://windowsserveronwaas.com/pdf/WoW_Sony_Ericsson_Case_Study.pdf - Paul Stephens, Global Head of Networks, Sony Ericsson
Match WAAS with CIO Budget Priorities 2 3 4 50%+ Servers Still Deployed Outside Data Center WAAS: Enables Server Consolidation & Virtualization 1 50% Servers Still Have Internal Storage WAAS: Helps Storage Consolidation & Data Protection Application Performance WAAS: Improves Employees Productivity WAN and Router Refresh WAAS: Reduces Branch IT Cost of Ownership
Chief Information Office (CIO) VP Application Services VP Operations Director Collaboration Software Architecture Group Director ERP Software Director,Infrastructure Services Director,Data Services DirectorSupport Services Director CRM Software ManagerServer Operations ManagerDatabase Operations ManagerHelp Desk DirectorHR Software ManagerStorage Operations ManagerRisk & Compliance ManagerSLA Monitoring Manager, Network & Security Operations Manager, Data Life Cycle Management ManagerDesktop Management ManagerData Center Facilities Target Storage Decision Makers
Storage Buyer Pain Points 50%+ branch servers have internal storage outside data center Data backup per site requires high TCO because • Online data backup can not complete overnight due to WAN limitations • Major CapEx: Disk arrays everywhere without economies of scale, encryption equipment • Major OpEx: Tape media, monthly service fees and administration cost for offsite vault 1: Microsoft, IDC 2008, 2: IDC Server Tracker, August, 2008
Data Backup Acceleration Solution • Server centralization through WAAS reduces local storage needs • WAN acceleration makes online-centralized backup possible • Veritas Netbackup, CommVault Galaxy, NT Backup, Legato Networker, IBM Tivoli Storage Management IBM Tivoli Storage Management Acceleration Windows NT Backup Acceleration
Accelerate data replication once all branch data backup is centralized: 70-90% faster data replication over the WAN Maximize ROI in WAN bandwidth Meet RPO and RTO Reduce real estate costs by extending the distance between primary & DR sites Data Replication Acceleration Solution With Cisco WAAS Without WAAS High utilization & throughput WAN bandwidth invested WAN bandwidth invested Low utilization & throughput 6 hour replication job 1 hour replication job
Demonstrate ROICisco on Cisco WAAS The ROI Numbers
Demonstrate ROIData Replication Acceleration A Large Office Supply Retailer May 16, 2008
Project Overview • Project Summary:The purpose of this project is to ensure that a Distribution Center's WMS computer systems can be recovered within a 24 hour period in the event of a disaster. To accomplish this we must implement some network optimization devices to speed the off-site replication of data to Omaha, reducing the Recovery Point Objective (RPO) to under 12 hours. Currently, the average RPO across 26 sites is 33 hours behind current data. • Project ScopeSignificant IT Infrastructure Failure: • WMS Server Failure • Storage Corruption or FailureCommunications Room Outage Not in scope • Full Warehouse Disaster
Definitions • Recovery Point Objective (RPO)The amount of data-loss that can be tolerated following the declaration of a disaster, measured in hours, established by the business.Core CE systems in Broomfield (InVision, E-Way, etc.) have an established 12 hour RPO. Target for WMS was set for 12 hours. • Recovery Time Objective (RTO)The time required to bring up the systems and applications to support the impacted business process following the declaration of a disaster, measured in hours. Core CE systems in Broomfield have an established 12 hour RTO (same as RPO). Target for WMS was set for 24 hours.
History…Old DR Plan Hmmm… Hurricane’s comin’ Better get the tapes when I leave…
Data Replication over the WAN WMS Linux Omaha DR Site History…Next Phase Problem: Not enough bandwidth to keep up with volume of data that is changing
Optimized network traffic 10 – 1000 times faster for data replication Cisco WAAS Cisco WAAS Wide Area Application Services - Data de-duplication WMS Linux Omaha DR Site Present
Future Hmmm… Hurricane’s comin’ Good thing the data in Omaha is less than 6 hours old I’m outta here…
Demonstrate ROI (Continued) • Documented Recovery Plan (approx. 8 hours) • Restore data to a spare WMS system in Omaha • Configure Applications for site-specific requirements • Bring up application in Omaha • Ship to site, or run in Omaha • RPO – All WMS sites are backed up every 6 hours to Omaha • Cost – Currently $70,000 below the CER target of $432,000 • Investigating some additional monitoring tools to ensure stability and performance of the infrastructure (potentially $50,000 spend)
Future ROI Opportunities • New standard established for routers to include WAAS modules. Deploy this technology to branch/sales offices as part of lease replacement. • Research feasibility to centralize file/print services, for PCI compliance and cost reduction. • Need to provide Plan for scanning field data for unencrypted CC numbers
Match WAAS with CIO Budget Priorities 2 3 4 50%+ Servers Still Deployed Outside Data Center WAAS: Enables Server Consolidation & Virtualization 1 50% Servers Still Have Internal Storage WAAS: Helps Storage Consolidation & Data Protection Application Performance WAAS: Improves Employees Productivity WAN and Router Refresh WAAS: Reduces Branch IT Cost of Ownership
Chief Information Office (CIO) VP Application Services VP Operations Director Collaboration Software Architecture Group Director ERP Software Director,Infrastructure Services Director,Data Services DirectorSupport Services Director CRM Software ManagerServer Operations ManagerDatabase Operations ManagerHelp Desk DirectorHR Software ManagerStorage Operations ManagerRisk & Compliance ManagerSLA Monitoring Manager, Network & Security Operations Manager, Data Life Cycle Management ManagerDesktop Management ManagerData Center Facilities Target Application Decision Makers
Application Buyer Pain Points Enterprise-wide collaboration applications are being rolled out • Microsoft Office: 500M seats (users) • Office 2007 adoption better than Office 2003 • Microsoft Exchange: 250M seats • Microsoft SharePoint: Explosive growth • 17,000 Sharepoint customers, 100M+ Sharepoint licenses • $1billion in licensed revenue Desktop virtualization is a major cost cutting initiative • Virtual Desktop Infrastructure (VDI) Benefits • Lower operating costs for desktops • Business continuity – tighten desktop control • Improve productivity – any desktop, any time • Desktop virtualization gaining traction as tool to address desktop Manageability, security, and cost 1 But most users are remote, they complain response time
Solution: Application Acceleration WAAS accelerates any TCP application by 2 to 100 times
Challenges: Customers scattered in rural areas R&D scientists distributed globally Time to market relied on real-time collaboration Strategy: Microsoft SharePoint portal centrally deployed for once LAN-like performance ensured for all Results: Average response time: From 270 to 8 seconds Bandwidth usage: From 90 to 50% Demonstrate ROIMicrosoft SharePoint Acceleration See Monsanto video testimonial: www.cisco.com/go/waas
Demonstrate ROI – Microsoft ExchangeA Law Firm in San Francisco Before (Friday 10/19): Average Response Time = 261 ms After (Friday 11/02): Average Response Time = 146 ms The response time for Exchange is nearly cut by half after optimization, this is version v4.0 without the MAPI application specific optimizer
VMware VDI Acceleration Solution Without WAAS • Difficult to deliver enterprise-wide desktop virtualization • Limited user scalability (4-5x bandwidth consumption vs VoIP) With WAAS • Desktop has LAN-like performance across WAN • Dramatically reduced bandwidth (60-70%) makes VDI cost effective Note: Typical WAN. 1.5 Mbps with 100 ms roundtrip latency WAAS makes application usable when delivered through VDI
VMware VDI Acceleration Solution WAAS makes Enterprise-wide VDI deployment possible
Match WAAS with CIO Budget Priorities 2 3 4 50%+ Servers Still Deployed Outside Data Center WAAS: Enables Server Consolidation & Virtualization 1 50% Servers Still Have Internal Storage WAAS: Helps Storage Consolidation & Data Protection Application Performance WAAS: Improves Employee Productivity WAN and Router Refresh WAAS: Reduces Branch IT Cost of Ownership
Chief Information Office (CIO) VP Application Services VP Operations Director Collaboration Software Architecture Group Director ERP Software Director,Infrastructure Services Director,Data Services DirectorSupport Services Director CRM Software ManagerServer Operations ManagerDatabase Operations ManagerHelp Desk DirectorHR Software ManagerStorage Operations ManagerRisk & Compliance ManagerSLA Monitoring Manager, Network & Security Operations Manager, Data Life Cycle Management ManagerDesktop Management ManagerData Center Facilities Target Network Decision Makers
Branch Equipment Sprawl 3G Modem Router Switch Wireless LAN WAN/App Optimization Security Appliance Voice Appliance Networking Buyer Pain Points Bandwidth upgrades costly and didn’t make applications faster • T1: $400 per month • Fractional DS-3: $3,000 per month • DS-3: $3,800 per month 1 Our group has to manage the solution, so we are worried about: • Adding yet another device to our plethora of equipment list • Punching holes in our security policy: Firewall, IDS/IPS • Re-architecting our QoS policy and network monitoring (Netflow, IPSLA) 1 Source: Global Communications Group on rates from Quest, Sprint and XO, Nov, 2008
Solution: Integrated WAN Optimization Branch Equipment Sprawl Integrated Services Router(ISR) 3G Modem Router Switch Wireless LAN Cisco ISR 3845 With Voice, Wireless, Video, WAN Optimization, Switch WAN/App Optimization Security Appliance Voice Appliance Offering lowest total cost of ownership: • Consolidated network infrastructure • Common platform for delivery of advanced services • Common service and support • No extra hardware and software support cost for the WAAS modules
Demonstrate ROIRouter Integrated WAN Optimization – Easier, Lower TCO Norcraft Companies is a recognized leader in the kitchen and bath industry. Challenges: • “If there was no regular IT support at a particular site, then we didn’t want to refresh a server there.” • “Each server costs $5K for the hardware, $1K for the operating system, and about $250 for the backup software.” • For 12 servers, the new CapEx would mean $75,000,” • “That decision drove us to explore solutions that did not require this type of CapEx every 3 years along with ongoing patch management.” Solution • ISR 2811 with WAAS modules Results • Avoided $75,000 capital expense of 12 new servers and ongoing server patch management • Maintained LAN-like application performance at remote locations • Reduced data redundancy over the WAN by 84 percent for Microsoft SQL • Reduced print traffic over the WAN by 68 percent “The modules that we ordered came preconfigured, and all the end users at the sites had to do was unhook a couple of wires, plug the cross-over cable that we sent them into the module, and power-on the device,” says Darin Wipf, Network Manager
Key Topics • Match WAAS with CIO budget priorities • Identify buyer pain points • Present prescriptive solutions • Demonstrate ROI
Top ROI Sales Collateral Read Forrester Total Economic Impact Report on Cisco WAAS: • www.cisco.com/go/waas, under “analyst coverage” Read Cisco WAAS Customer ROI Examples: http://www.cisco.com/en/US/prod/collateral/contnetw/ps5680/ps6870/case_study_c36-502424.html
ROI Study Conducted by Forrester http://www.cisco.com/en/US/prod/collateral/contnetw/ps5680/ps6870/case_study_tei.pdf
Call to Action • Attach WAAS to your ISR deals • Upsell to Windows on WAAS for WAVE appliance deals • Build ROI based value-proposition • Go into a Proof of Concept to win – plan ahead! • Leverage the resources available to you
Why Server Admin Cost Goes Down When Centralized • Virtualization • Automation • Higher reliability • Proper power, cooling, humidity