Models of selection
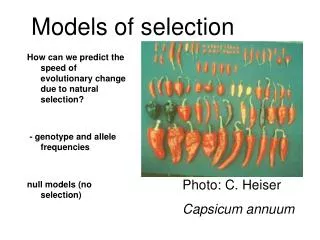
Models of selection. How can we predict the speed of evolutionary change due to natural selection? - genotype and allele frequencies null models (no selection). Photo: C. Heiser Capsicum annuum. Foré genetics. A population living in Papua New Guinea

Models of selection
E N D
Presentation Transcript
Models of selection How can we predict the speed of evolutionary change due to natural selection? - genotype and allele frequencies null models (no selection) Photo: C. Heiser Capsicum annuum
Foré genetics A population living in Papua New Guinea Young women and older women surveyed for genotypes at one locus (2 alleles: M or V). Genotype MM MV VV juvenile 31 72 37 adult 4 23 3
Genotype frequencies • Consider a diploid population with two alleles at one locus, A and a • [NOTE: for this class, large letters DO NOT indicate dominance, just another allele!] • At time t, • C(t) = frequency of AA individuals • H(t) = frequency of Aa individuals • S(t) = frequency of aa individuals • C(t) + H(t) + S(t) = 1 • (sum of the frequencies of all possibilities will always equal 1)
Genotype frequencies • The frequency of the A allele in this population, p(t), is given by the frequency of AA plus half of the frequency of Aa (since only half of the alleles in the heterozygote are A): • Similarly, the frequency of the a allele in this population, q(t) is given by the frequency of aa plus half of the frequency of Aa. • p(t) + q(t) = C(t) + H(t) + S(t) = 1 • The sum of the frequencies of the two possible alleles equals 1.
Find the genotype and allele frequencies for this example. Number AA = Frequency = Number Aa = Frequency = Number aa = Frequency = Total = 20 Total frequency = 1 Number A = Frequency = Number a = Frequency = Total = 40 Total frequency = 1
What happens to these frequencies over one generation? We will assume none of the forces of evolution are operating:
Random union Meiosis Model without selection Haploid stage (gametes) frequency: f(A) = p(t) = C(t) + 1/2 H(t) f(a) = q(t) = 1 - p(t) Meiosis: AA adults produce 100% A gametes Aa adults produce 50% A gametes aa adults produce 0% A gametes Diploid stage frequency: AA Aa aa C(t) H(t) S(t)
Random union Meiosis Model without selection Haploid stage (gametes) frequency: f(A) = p(t) f(a) = q(t) If adults are equally fertile, then gamete frequencies equal the allele frequencies in the adults that produce them. Diploid stage frequency: A a p(t) q(t)
Egg is drawn Sperm is drawn Offspring Random union Meiosis Allele A p Allele A p q Allele a Allele A p q Allele a q Allele a Random mating AA (prob p2) Aa (prob pq) aA (prob qp) aa (prob q2)
Egg is drawn Sperm is drawn Offspring Random union Meiosis Allele A p Allele A p q Allele a Allele A p q Allele a q Allele a Random mating AA (prob p2) Aa (prob pq) aA (prob qp) At time t+1 C(t+1) = freq(AA) =p2 H(t+1) = freq(Aa) = 2pq S(t+1) = freq(aa) = q2 aa (prob q2)
Effect of random mating At time t+1 C(t+1) = freq(AA) =p2 H(t+1) = freq(Aa) = 2pq S(t+1) = freq(aa) = q2
Allele frequencies in next generation At time t+1 C(t+1) = freq(AA) =p2 H(t+1) = freq(Aa) = 2pq S(t+1) = freq(aa) = q2 so, p(t+1) = C(t+1) + 1/2 H(t+1) = p2 + 2pq / 2 = p(p + q) = p Likewise, q(t+1) = q
Allele frequencies do not change in the absence of selection and with random mating. • What if one allele were dominant?
Random union Meiosis Adults Selection Using Hardy-Weinberg to detect selection frequency: f(A) = p(t) f(a) = q(t) Selection affects aa genotype f(AA) = p2 f(Aa) = 2pq f(aa) < q2
H-W in practice • In practice, we do not know p and q • We can calculate p and q for the adults. • Call these p' and q' (since they are after selection) • p' = f(AA) + 1/2 f(Aa) • q' = f(aa) + 1/2 f(Aa) • After selection p ≠ p‘ and q ≠ q'. • and f(AA) ≠ p'2 • f(Aa) ≠ 2p'q' • f(aa) ≠ q'2 We can use this to detect natural selection
H-W example p = f(A) = 0.5, q = f(a) = 0.5 If we have 100 zygotes: p2 * 100 = 25 AA; f(AA) = 0.25 2pq * 100 = 50 Aa; f(Aa) = 0.5 q2 * 100 = 25 aa; f(aa) = 0.25 10 aa die. Adult population: 25 AA; f’(AA) = 25 / 90 = 0.28 50 Aa; f’(Aa) = 50 / 90 = 0.56 15 aa; f’(aa) = 15 / 90 = 0.17 p’ = f’(A) = 0.25 + (0.56 / 2) = 0.56 q’ = 0.17 + (0.56 / 2) = 0.45
H-W example p = f(A) = 0.5, q = f(a) = 0.5 If we have 100 zygotes: p2 * 100 = 25 AA; f(AA) = 0.25 2pq * 100 = 50 Aa; f(Aa) = 0.5 q2 * 100 = 25 aa; f(aa) = 0.25 20 aa die. Adult population: 25 AA; f’(AA) = 25 / 80 = 0.313 50 Aa; f’(Aa) = 50 / 80 = 0.625 5 aa; f’(aa) = 15 / 80 = 0.063 p’ = f’(A) = 0.278 + (0.556 / 2) = 0.625 q’ = 0.167 + (0.556 / 2) = 0.375 Expected numbers of each genotype if population is in H-W? exp(AA) = p’2 * 90 = 31.3 exp(Aa) = 2p’q’ * 90 = 37.5 exp(aa) = 2q’2 * 90 = 11.3 Use 2 test to check: 2 = (obs – exp)2 / exp = (25 – 31.3)2 / 27.8 + (50 – 37.5)2 / 44.5 + (15 – 11.3)2 / 18.2 = Critical value: 3.84
References, readings, and study questions See sections 6.1 to 6.3 in the text, (3rd edition: 5.1 to 5.3) and answer question 1.