Download
1 / 79
790 likes | 809 Vues
This workshop explores the use of combustion indicators in experiments and models to analyze parameters like ignition delay, lift-off length, and heat release rate. Institutions and techniques are compared, and the influence of operating conditions and chemical mechanisms are discussed.

E N D
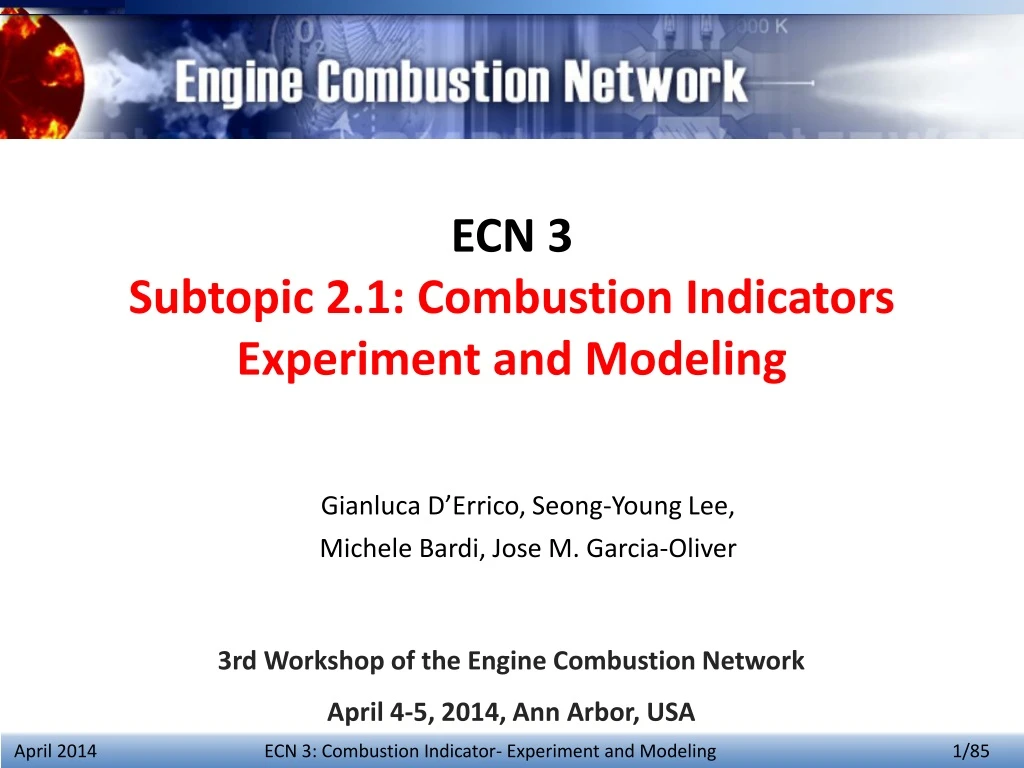
ECN 3 • Subtopic 2.1: Combustion Indicators • Experiment and Modeling Gianluca D’Errico, Seong-Young Lee, Michele Bardi, Jose M. Garcia-Oliver 3rd Workshop of the Engine Combustion Network April 4-5, 2014, Ann Arbor, USA
Topic 2.1 Combustion Indicator- OUTLINE • Introduction of Combustion Indicator • Objectives and Questions to be Addressed • Experimental Part • Institutions, Techniques and Operating Conditions • Comparison for Global Indicators of Experiment vs. Experiment • Standard measurement for LOL, ID to confirm trend variation • LOL from OH-PLIF comparison • New measurement- FL, Sr, peak concentration in OH-PLIF image • Modeling Part • Institutions, models and operating conditions • Comparison for Global Indicator of Model vs. Model • Parameters: ID, LOL, FL, Sr, maxOH, maxCH2O: more detail from groups • Comparison of Model vs. Experiment in Quantitative Data • Experimental data with modeling data from various groups • Comparison of Model vs. Experiment in Time Resolved Data • Heat Release Rate and Flame Tip Srt • Conclusion Remarks • Future work and Information for upload data and data availability
Objectives/ Questions to be Answered • OVERALL OBJECTIVES • Analyze model and experimental results to determine different parameters that can serve for a global description of the combustion process, namely: • Ignition Delay • Lift-off Length • Reactive Spray Penetration • Heat Release Rate • OVERARCHING QUESTIONS TO BE ADDRESSED • What is the measured and computed dependency of the main “combustion indicators” on the recommended parametric variations of the operating conditions? • What are the differences among experiments, among models and between models and experiments? What are the reasons for these differences? • What is the influence of the chemical mechanism? What is the influence of the turbulence-chemistry interaction?
TECHNIQUES AND INDICATORS Conventional CI New CI New CI
IFPEN SNL PARAMETERIC VARIATIONS • Conditions tested (n-dodecane) • The institutions used different nozzles: • SNL: 210677 (d0 = 0.0837 mm) / -370 (d0 = 0.0917 mm) • CMT: 210675 (d0 = 0.0893 mm) • IFPEN: 210678 (d0 = 0.0886mm) • IFPEN: 102.01, 102.04, 201.01 • TU/e: 201.02, -679 (d0 = 0.0841mm) CMT TU/e ParametricVariations SNL: 800 – 900 – 1000 – 1100 K CMT : 750 – 800 – 850 – 900 K IFPEN: 800 - 900 – 1000 - 1100 K SNL: 13 – 15 – 21% CMT: 13 – 15 – 21% IFPEN: 13 – 15 – 17 – 21% SNL: 7.6 – 15.2 – 22.8 kg/m3 CMT: 7.6 – 15.2 – 22.8 kg/m3 CMT: 50 – 100 -150 MPa TU/e: 50 – 100 – 150 MPa
COMPARISON BETWEEN INSTITUTIONS AND ANALYSIS • Ignition Delay (ID) and Lift-off Length (LOL) • Reactive Spray Penetration (Sr) • Flame length (FL) • Heat Release Rate (HRR)
Ignition Delays by Tamb at Various Institutions τSOC_CL τSOC_P • τSOC_CL: strong and non-linear temperature dependency while ID slope decreases with increasing ambient temperature • τSOC_P: strong and non-linear temperature dependency • All ignition delays tend to converge as the temperature increases except for Sandia data at 1100K due to the different criterion, 0.03 kPa as threshold • No significant variation with different institutions and injector models
Tamb Effect on ID and Uncertainty Ignition Delay (All Data) Uncertainty • Ignition delays appear collapse single profile while there are scatters at lower ambient temperature, 800K • Uncertainty is estimated by the ratio of one-sigma over averaged ignition delay at a fixed ambient temperature • Above Tamb=900K, uncertainty is approximately below 10% for τSOC_CL while large uncertainty is observed in τSOC_P
Tamb Effect on LOL and Uncertainty Lift-off length (LOL) Uncertainty • OH*-LOLs converge one single profile with very low uncertainty, below 10% • LOL profile shows non-linear behavior, similar to the ID profile • No significant deviation in various institutions and injector models
LOL Dependency of Ta, O2, Density and Pinj • All data (ECN3) were compiled to build an empirical relationship to predict LOL variations • There is a general good agreement with the literature • It will provide a guideline for modeling of spray dynamics [150MPa 900K 22.8kg/m3] [150MPa 900K 15%] [900K 15% 22.8kg/m3] [150MPa 15% 22.8kg/m3]
τSOC_CL Dependency of Ta, O2, Density and Pinj • All data (ECN3) were compiled to build an empirical relationship to predict τSOC_CL variations • There is a general good agreement and It will provide a guideline for prediction of flame ignition [150MPa 900K 22.8kg/m3] [150MPa 900K 15%] [150MPa 15% 22.8kg/m3] [900K 15% 22.8kg/m3]
COMPARISON BETWEEN INSTITUTIONS AND ANALYSIS • Ignition Delay (ID) and Lift-off Length (LOL) • Reactive Spray Penetration (Sr) • Flame length (FL) • Heat Release Rate (HRR)
Reactive Flame Tip Penetration (Sr) Methodology: Schlieren imaging Institution comparison at Ref condition (Spray A) • There is a general good agreement among the institutions and among various injection duration • Range of penetration scattering at fixed time is about 3-4 mm • Significantly lower penetration by Tu/e over the injection period • Diverging penetration when Sr>80mm.
Reactive Flame Tip Penetration (Sr) Methodology: Schlieren imaging Inert and Reactive penetration comparison Desantes et al. Combustion and Flames, 2014 • Reactive and inert penetration at a certain ASOI time after the ignition are diverging • The information is not representative of the start of ignition. This information can be useful when modeling spray morphology at reacting conditions • The indicator Sr/Si can bring valuable information Ignitionc
Reactive Flame Tip Penetration (Sr) Methodology: Schlieren imaging Inert and Reactive penetration • This parameter has been obtained at different conditions • It provides important guidelines on the spray morphology • Important information if we are attempting to model spray chemistry! • It give consistent results between different institutions (even when the penetration showed some discrepancies)
COMPARISON AND ANALYSIS • Ignition Delay (ID) and Lift-off Length (LOL) • Reactive Spray Penetration (Sr) • Flame Length (FL) • Heat Release Rate (HRR)
Flame Length (FL) Methodology: Broadband chem./OH *chem. CMT 675 - 21% O2/150 MPa CMT 675 - Spray A - 21% O2 CMT 675 - Spray A - 15% O2 Ignition Ignition • Soot incandescence radiation penetrates until a certain distance depending on injection pressure conditions • This distance is related with spray stoichiometric surface, flame length • Flame length is independent of injection pressure
SCALING LAWS FOR SPRAY LENGTHS Similar measurements from all the institutions
Flame Length (FL) • Important remarks: • To the moment the FL determination is based on thresholds that has to be further discussed • Important fluctuations are involved in the measurement • The long distance needed for the flame to stabilize makes FL measurable only at certain conditions • The approach needs further discussion but it shows promising results • The relationship between Sr, Si and FL and the related test conditions needs further understanding (new challenges for modelers!)
COMPARISON AND ANALYSIS • Ignition Delay (ID) and Lift-off Length (LOL) • Reactive Spray Penetration (Sr) • Flame length (FL) • Heat Release Rate (HRR)
Pressure Trace • Constant threshold for ignition delay analysis yields inconsistent results at high ambient temperature due to the effect of “ringing” Shortly after high-T ignition, ringing causes pressure traces to drop below zero. Use of averaged and smoothed trace requires a lower threshold at this ambient temperature to capture correct ignition timing. *The pressure shown in parenthesis indicates the threshold used for analysis
Pressure Rise and ROHR Methodology: narrow range pressure sensor in CV vessel (Lillo et al. SAE 2012-01-1239) • Pressure measurement for ID could give trouble especially when the ID premixed phase is reduced (i.e. short ID). • This has been observed at high ambient temperature • An adjustable polynomial fitting has been employed to fit raw data by SNL (filtering method developed at ETH) • The sensitivity is high until the first peak in pressure, then the following fluctuation are heavily filtered • Results are to the smoothed signal from the ensemble average
Pressure Rise and ROHR Methodology: narrow range pressure sensor in CV vessel (Lillo et al. SAE 2012-01-1239) By obtaining the ROHR by the smoothed curve, we defined the ignition delay as the instant corresponding to the highest peak in the ROHR curve The method still needs to be applied to more test conditions
LOL CORRELATION BETWEEN OH* AND OH-LIF • TUe (201.02) • HS OH* images • Schlieren movies at injection pressure of 50/100/150 MPa • OH-LIF images • Laser beam corrected images at 50/100/150MPa at 1100us and 5000us • IFPEN (201.01) • OH-LIF images • Laser beam corrected images of AR, O1, O3, T2, T3 at 150MPa at 5000us I1: [201.02 900K 15% 50MPa] I2: [201.02 900K 15% 100MPa] AR: [201.02 900K 15% 150MPa] AR: [201.01 900K 15% 150MPa] O1: [201.01 900K 13% 150MPa] T2: [201.01 800K 15% 150MPa] O3: [201.01 900K 21% 150MPa] T3: [201.01 1000K 15% 150MPa]
Background Subtraction Effect- TU/e Max_I=55.6 Beam corrected OH 10% OHmax 25% BGs OH 10% OHmax 10% OHmax 18% BGs OH 29% BGs OH 10% OHmax 10% OHmax 36% BGs OH 21% BGs OH [201.01 900K 15% 150MPa]
SENSITIVITY ANALYSIS of OH-LIF Threshold % of OH Max Intensity with Various Background Subtraction Detection of OH Signal Start 18.9 mm 4% 25% Background Subtraction 17 mm • Background subtraction (% of maximum intensity) from raw image and normalization • Apply 10% max OH to track the location of threshold from injector tip and define the LOL • Note that relatively high noise level after laser beam correction 13.7 mm BG Subtraction Imax=55.6 Due to Background Interference
Relation between OH* and OH-LIF- TU/e • A very good agreement of LOL between OH* and OH-LIF
LOL Comparison of OH-LIF and OH*- IFPEN • Background 5% subtraction were applied to all cases considered • A very good agreement of LOL between OH* and OH-LIF
CONCLUSIONS ON EXPERIMENTAL PART • The newly established experiment provides the rich database for the predictive model development and serves as the benchmark data for modeling • Experimental data including quantitative and time-resolved global indicators are available • Uncertainty for LOL and ID • LOL variation showsbelow 10% over various parametric sweeps • Chem-base ID relatively is reliable that Press-base ID • LOL and ID variations are minimal under various institutions and injector models • Heat release rate can be used for the definition of ignition delay • LOL-OH-LIF shows fairly good agreement with LOL OH* with limited conditions
Objectives/ Questions to be Answered • OVERALL OBJECTIVES • Analyze model and experimental results to determine different parameters that can serve for a global description of the combustion process, namely: • Ignition Delay • Lift-off Length • Reactive Spray Penetration • Heat Release Rate • OVERARCHING QUESTIONS TO BE ADDRESSED • What is the measured and computed dependency of the main “combustion indicators” on the recommended parametric variations of the operating conditions? • What are the differences among experiments, among models and between models and experiments? What are the reasons for these differences? • What is the influence of the chemical mechanism? What is the influence of the turbulence-chemistry interaction?
CONTRIBUTIONS ECN3: topic 2.1 • Modelling contributions ANL: Argonne National Laboratories (Som, Pei) ETH: Swiss Federal Institute of Technology in Zurich (Bolla) POLIMI: Politecnico di Milano (D’Errico, Lucchini) TUE: Technische Universiteit Eindhoven University of Technology (Somers) UNSW: The University of New South Wales (Hawkes, Chishty) WISC: University of Wisconsin, ERC (Wang)
Models for turbulence-chemistry interaction • Well-mixed (UNSW, WISC): • Mixing is fast relative to chemistry. • Fast mixing causes the scalar PDFs to be close to -functions. • Presumed PDF/flamelet approaches (ANL, POLIMI, TUE): • The thermochemical state-space is low-dimensional and described by a few parameters. • The forms of the parameter PDFs are known and described by a small number of moments • usually two, e.g. beta functions , Gaussian or one, e.g. delta function. • There is some way of obtaining thermochemical state conditional on the parameters.
Models for turbulence-chemistry interaction Presumed PDF/flamelets (ANL, POLIMI, TUE): • Chemistry is fast relative to mixing. • Ignition of a one-dimensional laminar non-premixed stagnation flow. (Or an approximation to this.) • Different table parameter choices possible. TUe - mixture fraction and progress variables. Beta PDFs for both. • ANL, POLIMI – transient multiple representative interacting flamelet with a beta PDF. Chemistry in online solved in the mixture fraction space. Each flamelet is representative of a fraction of the injected fuel mass. Average stoichiometric scalar dissipation rate values are passed to each flamelet.
Conditional Moment Closure (ETH) Models for turbulence-chemistry interaction Species Chemistry Conditional velocity Molecular mixing Conditional turbulent flux • Equations are solved for species and temperature, conditionally averaged on mixture fraction. • Conditional fluctuations are assumed to be small. • Mixture fraction PDF is presumed as a beta function. • In some respects similar to flamelets but the “tabulation” evolves in time and space. (In space, on a coarser grid than the CFD.)
Models for turbulence-chemistry interaction Transported PDF approaches (UNSW)
Chemical mechanisms Comparison among used kinetic mechanisms Constant volume homogeneous ignitions were modelled using SENKIN. Ignition was defined computationally as the time of the maximum rate of change of temperature. The following three chemical mechanisms were compared: - Narayanaswamy et al.: a 255 species mechanism. • Som et al.: 111 species skeletal mechanism (based on Luo et al. with the skeletal mechanism for OH* added). • Pei et al.: an 88 species reduced mechanism (quasi-steady state assumptions to the 111 species mechanism). The model was compared with ignition delays from shock tubes: o Pfahl et al. : n-decane, pressure = 50 bar, phi = 0.67, 1.0 and 2.0 o Zhukuv et al. : n-decane, pressure = 80 bar, phi = 1.0 o Vasu et al. : n-dodecane, pressure = 20 bar, phi =1.0. (The raw data were scaled to 20 bar) Separately Wang provided information on the validation of 106 species mechanism formulated at UW-ERC, showing good agreement with Narayanaswamy et al, especially at high temperatures.
Chemical mechanisms Comparison among used kinetic mechanisms • Results from Som et al. and Pei et al. are nearly identical. The Som et al. mechanism and the Narayanaswamy et al. do not significantly differ at low temperatures. The main difference is in the high temperature range. • For 50 bar or higher pressure, at temperatures below ~900K the mechanisms all over-predict the ignition delay, and there is little to distinguish between the mechanisms. This is significant because the spray A baseline ignites at a phi > 2.0 where the temperature is under 850K. • Narayanaswamy et al. mechanism mainly improves the high temperature behaviour relative to the starting detailed mechanism of Som et al.
Models for turbulence-chemistry interaction Parametric variations Models vs Experiments • First Ignition Delay/LOL analyis is shown for: • 1. Ambient Temperature [K]: 900 – 800 – 1000 – 1100 • 2. Injection pressure [MPa]: 150 – 100 - 50 • 3. Oxygen concentration [%]: 15 – 21 – 17 – 13 • 4. Ambient density [kg/m3]: 22.8 – 15.2 – 30.4 – 7.6 • For each operating point, one value of experimental data is reported with the observed scatter of data among different institutions.
Ignition delay/LOL Temperature sweep For the experimental data, a mean value for each operating condition is shown with a scatter bar of all data collected at different institutions. All models over-predict the ignition delay, while LOL is generally better estimated. Computed and experimental trends are generally in good agreement.
Ignition delay/LOL Results do not explicitly depend on the chemical scheme ETH and TUE have a lower ID for the baseline condition, but this is not confirmed for other operating conditions. POLIMI and UNSW have a similar trend and values. ANL has globally the lower ID for all conditions. Temperature sweep (ID) The over-prediction of ID by all groups is consistent with the chemistry sub-models over-predicting the ignition delay at high pressures and temperatures less than around 900K. Models show that the ignition shifts to richer (and thus cooler) regions as ambient temperature is increased, such that the ignition still occurs at a temperature less than 900K. This effect is due to the NTC.
Ignition delay/LOL Temperature sweep (LOL) Overall trends are good, but differences among models are significant. POLIMI and UNSW have generally the closer values to the measured data. Most relevant errors are WISC at 900 K, ANL at 800 K and TUE at 1100 K… not a unique “worse” condition! Absolute values might depend on the definition
Ignition delay/LOL Higher Error in the prediction of the ignition delay than of the lift-off length (chemistry?) There is no evident correlation between the two combustion indicators in any of the models.
Ignition delay/LOL Do the conclusions depend on the ID definition? • ETH and TUE provided results with both definitions: • - OH mass fraction: First time at which Favre-average OH mass fraction reaches 2% of the maximum in the domain after a stable flame is established. • Temperature rise:Time of maximum rate of rise of maximum temperature • Results are the same with both definitions.