Download
1 / 16
160 likes | 263 Vues
This presentation by Bradley Nickell, Director of Transmission Planning at the Western Electricity Coordinating Council, discusses the critical relationship between energy policy and wind energy investments. It explores regional transmission expansion planning, the implications of renewable portfolio standards (RPS), and the financial incentives that shape the renewable energy landscape. It emphasizes the importance of long-term policies in reducing risk and fostering market solutions. Attendees will gain insights into how strategic planning decisions affect the reliability and efficiency of the electric grid.

E N D
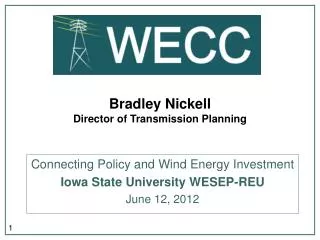
Bradley NickellDirector of Transmission Planning Connecting Policy and Wind Energy Investment Iowa State University WESEP-REU June 12, 2012
About WECC WECC’s mission is to promote and foster a reliable and efficient bulk electric system Non-Planning Functions Planning Functions Loads and Resources Assessments Reliability studies Transmission Expansion Planning • Compliance Monitoring and Enforcement • Standards Development • Reliability Coordination • Market-Operations interface • Operator training • WREGIS
Regional Transmission Expansion Planning Where are we today? Regional Transmission Expansion Planning (RTEP) • Completed WECC’s first 10-Year Regional Transmission Plan • In the 2nd year of the biennial planning cycle • Preparing for the creation of Interconnection-wide transmission plans in 2013 Understanding Impacts of decisions, not making determinations on what should be done
The Breeze Behind Wind Energy How Policy Impacts Investment Decisions • What’s driving the policy? • Cost and Risk • About Policies • Parting thoughts – The long KISS
What Drives Energy Policy? • Environmental concerns • Emissions • Land use • Job creation • Manufacturing and construction • Public sentiment • Money
Cost and RiskMonetizing the Future Today • Cost – Pricing the known • Equipment, financing • Risk – Pricing the unknown • Future cashflows, O&M, competition • Time - changes in costs/policies between investment decision and on-line dates • Policy impacts both • Equipment demand • Future tax treatment “Cost is cheap, Risk is expensive”
Renewable Energy Policies • Create markets • Renewable Portfolio Standards (RPS) • Reduce costs • Credits/loans/rebates • Increase costs for alternatives • Emission limitations/costs • Impact risk (real and perceived)
Renewable Portfolio Standards (RPS)Creating the Market • Requires renewable energy procurement • Vary in complexity • Driven by multiple goals • Directed at some/all retail load-serving entities • Attributes • Cost caps/off-ramps • Technology/ownership set-asides • Geography restrictions/incentives
RPS Policies www.dsireusa.org / May 2012 ME: 30% x 2000 New RE: 10% x 2017 VT: (1) RE meets any increase in retail sales x 2012; (2) 20% RE & CHP x 2017 WA: 15% x 2020* MN: 25% x 2025 (Xcel: 30% x 2020) MT: 15% x 2015 NH: 23.8% x 2025 MA: 22.1% x 2020 New RE: 15% x 2020(+1% annually thereafter) MI: 10% & 1,100 MW x 2015* ND: 10% x 2015 OR: 25% x 2025(large utilities)* 5% - 10% x 2025 (smaller utilities) SD: 10% x 2015 WI: Varies by utility; ~10% x 2015 statewide RI: 16% x 2020 NY: 29% x 2015 CO: 30% by 2020(IOUs) 10% by 2020 (co-ops & large munis)* CT: 27% x 2020 NV: 25% x 2025* OH: 25% x 2025† IA: 105 MW PA: ~18% x 2021† IL: 25% x 2025 WV: 25% x 2025*† NJ: 20.38% RE x 2021 + 5,316 GWh solar x 2026 IN: 10% x 2025† CA: 33% x 2020 KS: 20% x 2020 UT: 20% by 2025* VA: 15% x 2025* MO: 15% x 2021 MD: 20% x 2022 AZ: 15% x 2025 OK: 15% x 2015 NC: 12.5% x 2021(IOUs) 10% x 2018 (co-ops & munis) DE: 25% x 2026* NM: 20% x 2020(IOUs) 10% x 2020 (co-ops) DC DC: 20% x 2020 PR: 20% x 2035 TX: 5,880 MW x 2015 HI: 40% x 2030 29 states + DC and PR have an RPS (8 states have goals) Renewable portfolio standard Minimum solar or customer-sited requirement * Renewable portfolio goal Extra credit for solar or customer-sited renewables † Solar water heating eligible Includes non-renewable alternative resources
Financial IncentivesReducing the Cost • Tax Credits • Federal – PTC/ITC • State • Loans • Guarantees • Reduced rates • Direct payments • Grants • Rebates
Tax Credits for Renewables www.dsireusa.org / March 2012 DC 24 states offer tax credits for renewables Personal tax credit(s) only Puerto Rico Corporate tax credit(s) only Personal + corporate tax credit(s) Notes: This map does not include corporate or personal tax deductions or exemptions; or tax incentives for geothermal heat pumps.
2013 10- and 20-year Transmission PlansConnecting the Dots How might the Western Interconnection need to change to accommodate changes in the supply and demand for electric energy? • 10-year – understanding impacts of near-term decisions (bottoms-up) • 20-year – understanding drivers of potential energy futures (top-down) • The Plans tell the story of how they are connected
Parting ThoughtsThe Long KISS • Long-term policies reduce risk • Stabilize demand • Assure incentives • Simple policies reduce cost • Allow for market-based, least-cost solutions • Foster creativity
Questions Bradley Nickell Director of Transmission Planning Western Electricity Coordinating Council155 North 400 West Salt Lake City, Utah 84103 801.819.7604 bnickell@wecc.biz All information on the WECC 10-Year Regional Transmission Plan may be found at http://www.wecc.biz/10yrPlan.