Download
1 / 19
190 likes | 343 Vues
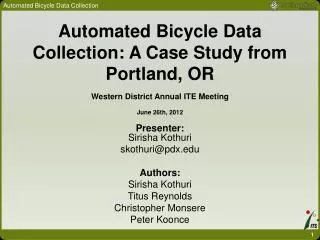
Automated Bicycle Data Collection. Automated Bicycle Data Collection: A Case Study from Portland, OR Western District Annual ITE Meeting June 26th, 2012. Presenter: Sirisha Kothuri skothuri@pdx.edu Authors: Sirisha Kothuri Titus Reynolds Christopher Monsere Peter Koonce.

E N D
Automated Bicycle Data Collection Automated Bicycle Data Collection: A Case Study from Portland, ORWestern District Annual ITE MeetingJune 26th, 2012 Presenter:SirishaKothuri skothuri@pdx.edu Authors: Sirisha Kothuri Titus Reynolds Christopher Monsere Peter Koonce
Automated Bicycle Data Collection Outline • Introduction • Study Area • Bicycle Counts • Bicycle Delay • Summary • Next Steps
Automated Bicycle Data Collection Our intentions are to be as sustainable a city as possible. That means socially, that means environmentally and that means economically. The bike is great on all three of those factors. You just can’t get a better transportation return on your investment than you get with promoting bicycling. – Mayor Sam Adams Source: P Koonce Introduction | Study Area | Bicycle Counts | Bicycle Delay | Summary | Next Steps
Automated Bicycle Data Collection Portland’s Bicycle Network • 2010 Bicycle Network • Bicycle boulevards • Bicycle lanes • Off street paths • Total system (314 mi) Source: R Geller Introduction | Study Area | Bicycle Counts | Bicycle Delay | Summary | Next Steps
Automated Bicycle Data Collection Portland’s Bicycle Network Source: R Geller Introduction | Study Area | Bicycle Counts | Bicycle Delay | Summary | Next Steps
Automated Bicycle Data Collection Where are we going? Introduction | Study Area | Bicycle Data | Pedestrian Data | Summary | Next Steps
Automated Bicycle Data Collection Why is this important? • Bicycle Data • Gaps/Deficiencies in data • Evaluation of system performance • Current demand estimation • Future infrastructure and operational needs • Prioritize investments • Improve safety Introduction | Study Area | Bicycle Counts | Bicycle Delay | Summary | Next Steps
Automated Bicycle Data Collection Objective • Utilize existing infrastructure to develop a long term monitoring and collection system to monitor bicycle activity. Introduction | Study Area | Bicycle Counts | Bicycle Delay | Summary | Next Steps
Automated Bicycle Data Collection Study Area • Bicycle Data • Bicycle Counts • Bicycle Delay • Pedestrian Data • Push button actuations • Pedestrian Delay I-5 I-84 US-26 Downtown I-205 OR -217 Introduction| Study Area | Bicycle Counts | Bicycle Delay | Summary | Next Steps
Automated Bicycle Data Collection Bicycle Data • Single inductive loops • Advance loop counts • Criteria for counts • Bicycle lane • Advance loop in bike lane • Individual loop wire • Communication Introduction| Study Area | Bicycle Counts | Bicycle Delay | Summary | Next Steps
Automated Bicycle Data Collection Count Verification • Video and loop counts • Underestimation of loop counts Inbound Loop Outbound Loop Introduction| Study Area | Bicycle Counts | Bicycle Delay | Summary | Next Steps
Automated Bicycle Data Collection Daily Trend Introduction| Study Area | Bicycle Counts | Bicycle Delay | Summary | Next Steps
Automated Bicycle Data Collection Weekday Trends Introduction| Study Area | Bicycle Counts | Bicycle Delay | Summary | Next Steps
Automated Bicycle Data Collection Bicycle Delay • Active at one intersection • Internal logic commands • Latch is set - • Bike is detected • Light status ≠ green • Latch is released • Light status = green • Delay = Duration of latch • Maximum delay per cycle Introduction| Study Area | Bicycle Counts| Bicycle Delay | Summary | Next Steps
Automated Bicycle Data Collection Bicycle Delay • Delay Reduction Strategies • Coordinated Free • Increase in permissive length Introduction| Study Area | Bicycle Counts| Bicycle Delay | Summary | Next Steps
Automated Bicycle Data Collection PORTAL • Regional data archive • Data currently archived: • Freeway loop detector • Weather • Incidents • Bluetooth • Bike and Ped • Arterial http://portal.its.pdx.edu/ Introduction| Study Area | Bicycle Counts | Bicycle Delay | Summary | Next Steps
Automated Bicycle Data Collection Conclusions • Growing need for bicycle data • Operations • Planning • Bicycle counts from inductive loops • Cost effective • Potential for undercounting • Affected by placement, sensitivity and calibration Introduction| Study Area | Bicycle Counts | Bicycle Delay | Summary | Next Steps
Next Steps Automated Bicycle Data Collection • Expansion and verification of counts • Expansion of bicycle delay to other intersections • Optimizing signal timing based on delay 18 Introduction| Study Area | Bicycle Counts | Bicycle Delay | Summary | Next Steps
Automated Bicycle Data Collection Thank you! Sirisha Kothuri skothuri@pdx.edu Titus Reynolds titus.reynolds@portland oregon.gov Christopher Monsere monsere@pdx.edu Peter Koonce peter.koonce@portlandoregon.gov http://portal.its.pdx.edu/