Download
1 / 51
530 likes | 1.3k Vues
Health Care Policy Reading: Wilson (Ch. 6) “Universal Care”; “Rising Health Costs” (CQ Researcher) Debate: Should the government provide universal health care? The “Solo Doctor/Progressive Regime” (1800s – 1965) Pre-1930’s Routine health care a luxury for most Americans

E N D
Health Care Policy Reading: Wilson (Ch. 6) “Universal Care”; “Rising Health Costs” (CQ Researcher) Debate: Should the government provide universal health care?
The “Solo Doctor/Progressive Regime” (1800s – 1965) • Pre-1930’s • Routine health care a luxury for most Americans • patients pay doctor for services • 1930’s – 1965 • Private/public health insurance becomes increasingly available (primarily local) • Rise of “third-party payment system”
The “Solo Doctor/Progressive Regime” Source: Cato Institute www.cato.org/pubs/pas/pa211.html
The “Solo Doctor/Progressive Regime” • The Rise of Private health insurance • emergence of labor unions in 1930’s • labor shortages during WWII • postwar economic prosperity • 2/3 of population had health insurance by 1960
The Medicare/Medicaid Policy Regime (1965-?) • 1965: Introduction of Medicaid and Medicare programs (more in a minute) • 1970’s-1990’s: Rise of Managed Care (HMO’s) • 1973: Health Maintenance Organization Act – provided funds and regulatory support • HMO enrollment: • 1980: 7.9 million • 1990: 25 million • Today: roughly 150 million
The Medicare/Medicaid Policy Regime (1965-?) • How has this shift in policy regimes changed the politics of health care?
Table 5.9 Private Health Insurance Enrollment by Plan Type, 1988-2005 Since 1988, Conventional Fee-for-Service plans have almost disappeared, while PPOs have grown significantly. Source:Employer Health Benefits, 2001-2005 Annual Survey, The Kaiser Family Foundation and Health Research and Educational Trust. Trends and Indicators in the Changing Health Care Marketplace, 2002 – Chartbook.
Table 5.5 Average Annual Premium Costs by Plan Type, 2005 Average premiums vary by plan type. All Plans Conventional FFS HMO PPO POS Source: Kaiser/HRET Survey of Employer-Sponsored Health Benefits: 2005.
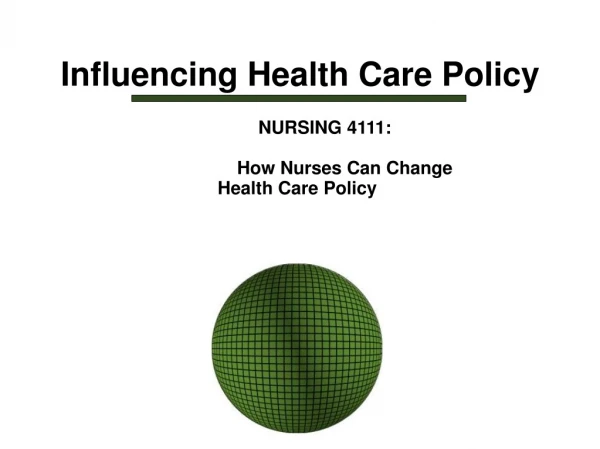
Public Health Care Programs • Existing public programs provide: • direct medical services to segments of the population; • offer medical care insurance to others; and • support the health of the entire population through public health programs, regulation, and research
Public Health Care Programs • Public involvement in U.S. health care is substantial: • In 1992, almost 40 percent of all health care expenditures were made by federal agencies. • In 2001, that number rose to over 44 percent and in 2003 it rose to 46 percent • while this percentage is lower than in other industrialized democracies, federal involvement in health care is still significant.
Medicare • Medicare: Social Security Amendments of 1965: • Part A: Hospitalization • financed through payroll taxation; subject to deductibles and coinsurance • Part B: Supplementary insurance for fees and outpatient services • financed by the insured through premiums ($88.50 per month in 2006); Subject to deductibles and coinsurance • Part C: “Medicare Plus Choice” (option of joining HMO) • Part D: Prescription Drug Coverage • effective in 2006; Program participants pay first $250 of their annual drug costs, then $500 of the next $2000, but then must pay the next $2850 before coverage begins again (at 95%) • individuals pay $20 - $40 per month for this service
Medicare • Medicare is a better plan than the private sector would offer the elderly: • no physical exam • covers preexisting health conditions • uniformly available throughout the country
Medicare • Difficulties with Medicare administration: • costs of deductibles and coinsurance may burden less affluent persons • does not cover all medical expenses that are often needed by the elderly—the primary intended beneficiaries of the program: • does not cover: eye exams or eye glasses; dental exams or dentures preventive exams; immunizations; or long-term care
Table 4.2 Personal Health Care Expenditures by Type of Service and Percent Medicare Paid, 2004 Total personal health care spending in 2004 was $1.56 trillion; Medicare accounted for over 19%. $570.8 Billion Medicare pays 28.6% $399.9 Billion Medicare pays 20.5% 1 $188.5 Billion Medicare pays 1.8% $115.2 Billion Medicare pays 13.9% $81.5 Billion Medicare pays 0.1% $52.7 Billion Medicare pays 19.2% $53.3 Billion Medicare pays 0% $43.2 Billion Medicare pays 37.9% $32.3 Billion Medicare pays 5.9% $23 Billion Medicare pays 28.3% 1 Medicare payments are mostly from managed care plans, since fee-for-service Medicare did not generally cover outpatient prescription drugs in 2004. Source: CMS, Office of the Actuary, National Health Statistics Group.
Table 4.7 Medicare Beneficiaries as a Share of the U.S. Population, 1970-2030 The U.S. population will age rapidly through 2030, when 22 percent of the populationwill be eligible for Medicare. 22.0% 2.4 18.5% 2.7 15.0% 13.9% 13.1% 2.4 12.1% 1.9 1.2 1.3 9.5% 9.5 10.8 11.9 12.0 12.6 15.8 19.5 Total Number of Medicare Beneficiaries: (millions) 20.4 28.4 34.3 39.6 46.5 61.6 78.6 Source: Social Security Administration, Office of the Actuary.
Table 4.5 Medicare Trustee’s Report: Part A Income and Expenses, 1970-2015 Projected Expenditures First Exceed Projected Income in 2011 Actual Projected . Source: CMS, Office of the Actuary.Trustees Report, 2006.
Medicaid • Medicaid (1965) provides federal matching funds to state and local governments to help pay for medical care for the “medically indigent.” • Medicaid is administered by states; eligibility, benefits, and administration vary considerably by state: • If a state chooses to have a Medicaid program, it must: • provide medical care benefits for all welfare recipients and Supplemental Security Income (SSI) recipients • provide certain base benefits such as hospitalization and lab services
Medicaid • States may also extend benefits beyond the base benefits to cover prescription drugs and other services. • Federal requirements are becoming more stringent for the range of services that states must provide, thus imposing additional costs.
Medicaid • Problems with Medicaid include: • variability of benefits and coverage across the country • fraud and abuse • estimated to account for up to 7 percent of federal outlays • typically perpetrated by service providers, not patients • strain on fiscal resources of state governments • states must often cut back on: • optional services; • reduce coverage of primary care; and • set limits on physician reimbursements below those specified by the federal government.
Table 4.25 Medicaid Enrollment by Eligibility Group, 2003 Payments for the elderly, blind and disabled account for 69 percent of total payments. Total Enrollees = 52.4 million Total Expenditures = $235 billion Elderly 9% Elderly 26% Blind & Disabled 16% Adults 27% Blind & Disabled 43% Children 48% Adults 12% Children 19% Note: Expenditure distribution based on Congressional Budget Office data that includes only federal spending on services and excludes DSH payments, supplemental provider payments, vaccines for children, administration, and the temporary Federal Medicaid Assistance Percentage Increase.. Source: Kaiser Family Foundation, Trends and Indicators in the Changing Health Care Marketplace Chartbook 2004.
Table 4.26 Average Medicaid Payments per Person Served by Eligibility Group, 1985-2003 Per capita payments for the elderly, blind and individuals with disabilities continue to be significantly higher than payments for other groups. $13,677 $13,303 $2,292 $1,606 1985 1988 1990 1995 1998 2003 Source: CMS, CMSO, HCFA-2802 reports; Medicaid Statistical Information System.
Table 4.29 Total State Spending and Federal Funds Provided to States, 2004 Over twenty-two percent of state total spending and over forty-four percent of federalfunds provided to states were spent on Medicaid. Total State Spending Federal Funds Provided to States Elementary & Secondary Education 11.4% Higher Education 10.9% Higher Education 5.6% Public Assistance 3.6% Elementary & Secondary Education 21.4% Public Assistance 2.1% Transportation 8.0% Corrections 0.6% Transportation 8.0% Medicaid 22.3% Corrections 3.5% All Other 26.3% Medicaid 44.5% All Other 31.7% Source: National Association of State Budget Officers, 2004 State Expenditure Report.
Problems in Health Care • Three major problems in the US health care system: • cost • quality • access
Cost of Health Care • Cost: the health care “problem that won’t go away.” • Rising costs are the driving force in health care reform: • Hospital costs increased 298% more over a forty-year period compared to total consumer prices. • The total cost of health care is driven by two factors. • The number of medical procedures conducted • The costs of medical procedures
Cost of Health Care • Factors causing increases in U.S. health care costs: • rapid increase in cost of supplies and equipment: • MRI and CAT scanning units • rapid increase in labor costs: unionization of hospital employees • overinvestment in technology • the complex system of medical administration: some estimates set administrative costs at 25%, roughly twice that of Canada • physician costs: • malpractice insurance; • practicing “defensive medicine;” and • high rates of specialization • the federal government attempts to control physician costs in Medicare costs using a “resource-based relative value scale” (RBRVS), which assigns reasonable costs and reimbursements for procedures
Table 1.1 National Health Expenditures and Their Share of Gross Domestic Product (GDP), 1980-2015 National health spending is projected to continue to increase as ashare of GDP over the next decade. Projected Actual Source: CMS, Office of the Actuary, National Health Statistics Group.
Table 1.15 Average Annual Salaries for Selected Groups of Workers, 2005 Health professionals earn higher than average incomes. All Workers Professional, Technical, Specialty Workers Health Professionals Source: National Compensation Survey: Occupational Wages in the US, June 2005 . US Department of Labor, July 2006.
Table 1.9 Factors Accounting for Growth in Prescription Drug Spendingper Capita, 1980-2011 Drug Prices and Utilization significantly affect prescription drug spending per capita. 12.3% 10.7% 8.3% 8.2% 8.1% 8.0% 7.7% * Note: Utilization also includes the effects of intensity and population growth. Per capita drug spending in 1990 was $252 * Without the effect of Part D, overall growth would be 8.1% (price: 3.8%, Utilization 4.3%) Source: CMS, Office of the Actuary, Health Affairs Web Exclusive, Exhibit 6, pp. W70
Table 1.20 Annual Growth Rates in the Overall Consumer Price Index (CPI) and Medical-Specific Consumer Price Index (MCPI), 1993-2005 Medical prices have risen faster than overall consumer prices. MCPI CPI Source: Dept. of Labor, the Bureau of Labor Statistics.
Table 2.1 Percent of GDP Spent on Health Care by OECD Country, 1960-2004 The U.S. has had a higher share of GDP spent on health than the OECD median forthe past four decades. Median: 3.9% 5.1% 6.8% 7.5% 9.6 % *For 1960, no data was available. **2003 data was used because 2004 were not available. Note: The data is arrayed by spending growth from 1990 to 2004. The medians include all OECD countries. Source: OECD Health Data 2006.
Quality • Questions about the quality of care arise from both overtreatment and undertreatment; both of these can result from financial incentives: • overtreatment to avoid liability, malpractice suits, and in reaction to incentives under fee-for-service medical plans • undertreatment to avoid costs in managed-care situations • current quality problems relate more to undertreatment than overtreatment • “Gag rules” may prevent doctors from informing patients about more expensive treatments. • Some states are now making insurance companies and health maintenance organizations liable if they fail to provide information and needed care.
Table 2.9 Infant Mortality Rates per 1,000 Live Births by OECD Country, 1970-2004 OECD country infant mortality rates have declined since 1970. United States Median Canada France Japan United States Canada Median France Japan Note: The median includes all OECD countries. The decrease from 1960-2004 is in percentage points. 2003 data used for Canada and the United States as the latest available. Source: OECD Health Data 2006.
Table 2.10 Male and Female Life Expectancy at Birth by OECD Country,1960-2004 Japan has the highest life expectancy at birth for both males and females. Male Female * Median = 67.2 70.0 76.4 Median = 72.5 76.6 81.4 *2003 data was used because 2004 was not available. Note: Data are arrayed by male life expectancy; countries are kept together. The medians include all OECD countries. Source: OECD Health Data 2006
Table 2.13 Average Length of Hospital Stay For Selected OECD Countries, 2004 The length of stay for specific procedures varies differently from total length of stay Average Length of Stay- In-Patient Acute Average Length of Stay- Appendicitis* *2003 Data.; **2002 data ***no data available Countries are listed alphabetically. Data Expressed in Days Source: OECD Health Data 2006.
Access to Medical Care • For any health care system to function effectively, prospective patients must have access to the system. • The most commonly cited barrier to access is economics: • As of 2004, almost 30 percent of those below the poverty line were ineligible for Medicaid. • Medical insurance is also a problem for the middle class: • In 2003, almost two-thirds of the uninsured had incomes over $25,000, and one third had incomes over $50,000. • The trends in health care access are getting worse: • Between 1990 and 1995, the percentage of people with private health coverage dropped from 75 percent to 70.5 percent: • In 2003, it dropped to 68.6 percent. • Employee contributions toward health coverage and patient out-of-pocket costs are increasing. • Not having health insurance portability limits job mobility: • The Kennedy-Kassebaum bill, passed after the failure of the Clinton health care proposals, improved portability.
Table 6.3 The Percent Uninsured Within Age Categories, 1987-2005 Adults age 18-54 have twice the percentage uninsured as children in 2005 . Note: Under 65 population. Source: Tabulations of the March Current Population Survey files by Actuarial Research Corporation, incorporating their historical adjustments.
Table 4.27 Medicaid Enrollees and Beneficiaries by Eligibility Group, 1975-2003 Children historically represent the largest group of Medicaid enrollees. Adults 14.3 million enrollees 11.7 m beneficiaries Children Under 21 27.3 million enrollees 24.8 million beneficiaries Blind & Disabled 8.4 million enrollees 7.7 million beneficiaries Age 65 & Older 5.2 million enrollees 4 million beneficiaries 2003 Total =55.2 million Enrollees Other** Medicaid “enrollees” are those who are enrolled in Medicaid at any time during the fiscal period. “Beneficiaries” are those for whom services have been reimbursed during the fiscal period. *Note: (1) In 1998, a large increase occurred in the number of persons served which is mainly the result of a new reporting methodology of classifying payments to managed care organizations; FY 1998 was the first year capitation payments were counted as a service for purposes of the HCFA 2082 reporting, and thus all managed care enrollees were counted as individuals receiving services; this new methodology probably has the greatest effect on the reported number of children; (2) the term “adults” as used above refers to non-elderly, non-disabled adults; (3) disabled children are included in the blind & disabled category shown above. **The Other category was dropped in 1999. Source: CMS, CMSO, Medicaid Statistical Information System.
Table 6.4 Percent Uninsured Within Income Category, 1987-2005 Lower-income groups are more likely to be uninsured than higher-income groups. Note: Under 65 population. Colored lines represent income as a percentage of the poverty line. Source: Tabulations of the March Current Population Survey files by Actuarial Research Corporation, incorporating their historical adjustments.
Table 6.5 Percent Uninsured by Ethnicity, 1987-2005 About half of the uninsured are white, and the other half are racial or ethnic minorities. Hispanic Hispanic Non-Hispanic American Indian Non-Hispanic American Indian Non-Hispanic Black Non-Hispanic Black Non-Hispanic Asian Total Non-Hispanic Asian Other Total Other Note: Under 65 population. Source: Tabulations of the March Current Population Survey files by Actuarial Research Corporation, incorporating their historical adjustments.
Table 6.9 The Uninsured by State, 2005 The South and West have higher rates of uninsured than the Mid-west and East. WA NH ME VT MT ND MN OR WI NY MA ID SD MI RI WY CT PA NJ IA OH NE DE NV IN IL MD WV UT VA CO DC CA KS MO KY NC TN OK AR SC NM AZ AL GA MS TX LA FL AK HI Low (7% - 13.9%) Medium (14% - 17.9%) National average is 16% High (18%+) *Other includes private non-group and other public insurance (mostly Medicare and military-related). Medicaid includes CHIP. Source: Census Bureau, March Current Population Survey.
Immigrants and Health Care Access • Access to Private Health Insurance • Job-based health insurance is offered to 87 percent of non-Hispanic white citizen workers, but only to 50 percent of Latino immigrant workers. • when they are offered health insurance, comparable numbers of white citizens and Latino immigrants accept the offer and take employer-sponsored insurance (87 percent of white citizen workers and 81 percent of Latino immigrant workers). (Source: MPI)
Immigrants and Health Care Access • What explains lack of access to Private Insurance? • frequently work in the types of industries that are less likely to offer health insurance • employers may be able to effectively treat immigrants — even legal immigrants — differently by classifying them as contract, temporary, or part-time workers, so they are not required to offer benefits • It is not clear whether discrimination is a cause • (Source: MPI)
Immigrants and Health Care Access • Access to Public Health Insurance • not all immigrants are eligible for Medicaid and its counterpart, the State Children's Health Insurance Program (SCHIP). • The 1996 welfare reform law prohibited most lawful permanent residents admitted after the law's enactment from receiving federal Medicaid or SCHIP coverage during their first five years in the United States • Unauthorized immigrants and temporary visa holders (e.g., those with student or temporary work visas) are not eligible for Medicaid, except for Medicaid coverage of emergency room services. • (Source: MPI)
Pursuit of Universal Health Insurance • Universal health care was considered by the Truman Administration (1945), but this was criticized by the AMA as “socialized medicine.” • Medicare/Medicaid 1965 • In 1991, Sen. Harris Wofford (D-PA) was elected after campaigning on the issue of national health care.
Types of Universal Health Care • Single-Payer Systems • Great Britain – Gov’t manages every aspect of health care system • Canada • National gov’t – funding • Provincial gov’ts – manage hospitals • Doctors in private practice contract with the government for fee-for-service payments • U.S. – Medicare is a single-payer health care program (though not nearly universal in coverage) • (Link to Physicians for a National Health Program)
Types of Universal Health Care • “Play or Pay”—the basic idea with “play or pay” is that employers either provide insurance to workers (“play”) or contribute to a public insurance program that would cover their employees and others without insurance (“pay”): • Most plans call for a tax of 7 or 8 percent of payroll for employers choosing to pay rather than play. • This system preserves the existing insurance system. • It also preserves the fee-for-service medical care system. • It allows companies to provide improved benefits to employees. • The principal criticism is from small businesses that claim the plan would drive them out of business.
Types of Universal Health Care • Clinton proposed a complex plan that depended on “alliances” of health care providers: • Alliances would provide all of their members’ health care needs for a set annual fee. • Fee-for-service plans would also be available. • Fees were fixed at an average of $1,800 for individuals and $4,200 for families—below private insurance rates • Employers would be required to pay for employees, and subsidies would be available for small businesses. • Universal coverage was a central tenet of the plan, and this was the issue on which the president said he would not compromise. • The Clinton plan encountered numerous criticisms: • excessive complexity • universality would be too costly • huge and costly federal bureaucracy would be created
National Election Study 2004 • “There is much concern about the rapid rise in medical and hospital costs. Some people feel there should be a government insurance plan which would cover all medical and hospital expenses for everyone. Suppose these people are at one end of a scale, at point 1. Others feel that all medical expenses should be paid by individuals through private insurance plans like Blue Cross or other company paid plans. Suppose these people are at the other end, at point 7. And, of course, some other people have opinions somewhere in between, at points 2, 3, 4, 5, or 6.”