Download
1 / 13
130 likes | 292 Vues
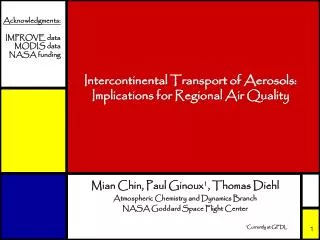
Acknowledgments: IMPROVE data MODIS data NASA funding. Intercontinental Transport of Aerosols: Implications for Regional Air Quality. Mian Chin, Paul Ginoux 1 , Thomas Diehl Atmospheric Chemistry and Dynamics Branch NASA Goddard Space Flight Center 1 Currently at GFDL. MODIS. GOCART.

E N D
Acknowledgments: IMPROVE data MODIS data NASA funding Intercontinental Transport of Aerosols: Implications for Regional Air Quality Mian Chin, Paul Ginoux1, Thomas Diehl Atmospheric Chemistry and Dynamics Branch NASA Goddard Space Flight Center 1Currently at GFDL
MODIS GOCART Introduction • Concentration of aerosol particles, also known as particulate matter (PM), is one of the major components that determine ambient air quality • While local and regional emission sources are the main cause of air pollution problems, aerosols can be transported on a hemispheric or global scale
Introduction (2) • We use the global model GOCART to answer the following questions: • What is the contribution of regional anthropogenic emission to the PM2.5 concentrations over the U.S.? • What is the contribution of long-range transport to the surface PM2.5 concentrations over the U.S. ? • What is the seasonal variation of the “background” PM2.5?
NW NW NE NE SW SW SE SE Model Surface data Comparison with the IMPROVE data of surface PM2.5 concentrations • PM2.5 composition assumed in the model: • Sulfate • BC • OC • Fine mode dust • Fine mode sea-salt 200104 Model Surface data 200109
Sulfate BC GOCART OC Fine Dust PM2.5 Surface aerosol concentrations at IMPROVE sites Overall comparison of monthly mean PM2.5 concentrations at all IMPROVE sites for 2001 Comparisons of daily average aerosol concentrations at 3 IMPROVE sites for 2001. Red circles: IMPROVE data. Black lines: GOCART model
Model Experiments(for US air quality study) SU BC OC DU
Major Aerosol Source Regions Sulfur NAM EUR ASA Dust AFR MDE ASA
NW NE SW SE Surface PM2.5 Concentrations Local anthrop. • Eastern: • Less than 40% PM2.5 is “background” • Nearly 1/3 is “natural” (dust, biogenic aerosols) • Western: • About 70% PM2.5 is “background” • Nearly 60% is “natural” (dust, biogenic aerosols) Local anthrop. Int. anthrop. Int. anthrop. Total natural. Total natural. Local anthrop. Int. anthrop. Int. anthrop. Local anthrop. Total natural. Total natural. Monthly average surface layer PM2.5 concentrations in 2001 from the GOCART model (see earlier pages for experiment definition). Annual average concentrations and contributions from different sources are shown. ALL – BKG = NAM pollution BKG – NAT = pollution from other regions
NW NE SW SE Surface Sulfate Concentrations • Eastern: • More than 90% sulfate is from NAM local/ regional pollution • Western: • 70 – 80% sulfate is from NAM local/ regional pollution Monthly average surface layer sulfate concentrations in 2001 from the GOCART model (see earlier pages for experiment definition). Annual average concentrations and contributions from different sources are shown.
NW NE SW SE Surface Fine Mode Dust Concentrations • NW: • 1/2 fine mode dust is from Asia, 1/4 from Africa • Eastern: • About 1/2 fine mode dust is from Asia • Nearly 30% fine mode dust is from Africa • SW: • About 60% fine mode dust is “local” (20% Asia, 13% Africa, 5% Middle East Monthly average surface layer find mode dust concentrations in 2001 from the GOCART model (see earlier pages for experiment definition). Annual average concentrations and contributions from different sources are shown.
Altitude (km) SO4= µg m-3 Altitude (km) % from Asia Altitude (km) % from Europe Altitude (km) % from N America Latitude Hemispheric Transport – How do the “foreign sources” affect US air quality? (April 2001 as an example) West Coast East Coast Sulfate Over North America: • Most sulfate stays in the boundary layer • Pollution from Asia can travel around the hemisphere at higher altitudes above BL • European pollution makes its way over N. America at higher latitudes • In the BL over North America, most sulfate is from is own regional source
Altitude (km) Dust µg m-3 Altitude (km) % from Asia Altitude (km) % from Middle East Altitude (km) % from Africa Latitude Hemispheric Transport – How do the “foreign sources” affect US air quality? (April 2001 as an example) West Coast East Coast Dust Over North America: • Dust plume has broad vertical extension above the BL • Most dust below 6 – 7 km is from Asia • Dust from the Middle East contributes to about 10% dust loading • African dust is an important contributor to the dust level in the tropics and at high altitudes above 6 – 7 km
Conclusions • Surface PM2.5: • Western: • 30% domestic anthropogenic • 60% “natural” • 10% anthropogenic from other continents • Eastern: • 60% domestic anthropogenic • 30% natural • 10% anthropogenic from other continents • Surface sulfate: • Western: • 70-80% domestic anthropogenic • Eastern: • 90% domestic anthropogenic • Surface fine mode dust: • Southwestern: • 60% from local desert • Other regions: • 50% from Asia • 25-30% from Africa • The “background” PM2.5 has large seasonal variations, with the highest values in April-May-June