Download

1 / 7
70 likes | 199 Vues
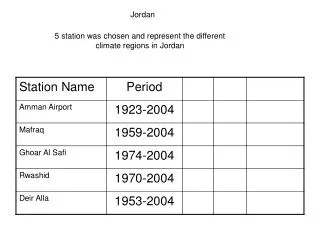
This analysis covers temperature changes over several years, specifically from October 27, 2001, to October 27, 2009, and January 30, 2001, to January 30, 2009. The data indicates a consistent increase in temperatures over the years, highlighting significant trends in ocean temperatures. It is noted that ocean temperatures peaked during the summer and fall months. Various charts illustrate minimum, maximum, and average daily ocean temperatures as well as their standard deviations, reinforcing the conclusion that temperatures are rising, particularly from June through October.

E N D
Jordan Valenciano CSE3 Lab6
This chart describes the temperature changes between 10/27/2001 to 10/27/2009. We can conclude that temperature has increased over the years.
This chart describes the temperature changes between 1/30/2001 to 1/30/2009. We can conclude that temperature has increased over the years.
This chart describes the average temperatures throughout the years. We can see that the ocean temperature was higher during the summer/fall months.
This chart shows the minimum, maximum, and average ocean daily temperatures.
This chart shows the standard deviation of daily ocean temperatures between 2001-2009.
Basically from all these charts we can see that temperature has increased over the years. We can also conclude that from June through October the temperatures were the highest.