Download
1 / 2
20 likes | 116 Vues
Stage 1: Choose NRS Household projection scenario. Can be adjusted if required. Stage 2: Add existing need figure which should represent required new dwellings. Can use in-built estimates or use own. Stage 3: Choose income data and scenarios over future growth and distribution.

E N D
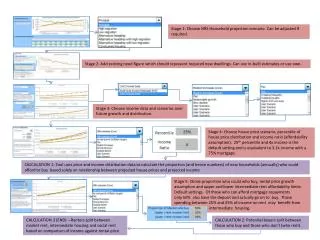
Stage 1: Choose NRS Household projection scenario. Can be adjusted if required. Stage 2: Add existing need figure which should represent required new dwellings. Can use in-built estimates or use own. Stage 3: Choose income data and scenarios over future growth and distribution. Stage 4: Choose house price scenario, percentile of house price distribution and income ratio (affordability assumption). 25th percentile and 4x income is the default setting and is equivalent to 3.2x income with a 75% mortgage. CALCULATION 1: Tool uses price and income distribution data to calculate the proportion (and hence numbers) of new households (annually) who could afford to buy based solely on relationship between projected house prices and projected income Stage 5: Chose proportion who could who buy, rental price growth assumption and upper and lower intermediate rent affordability limits. Default settings. Of those who can afford mortgage repayments only 50% also have the deposit and actually go on to buy. Those spending between 25% and 35% of income on rent may benefit from intermediate housing. CALCULATION 3 (END) –Renters split between market rent, intermediate housing and social rent based on comparison of income against rental price CALCULATION 2: Potential buyers split between those who buy and those who don’t (who rent).
All New and Existing Households Calculation 1: Tool uses price and income distribution data to calculate the proportion (and hence numbers) of new households (annually) who could afford to buy based solely on relationship between projected house prices and projected income Default: LQ price to 4 income Potential buyers Renters Calculation 2: Potential buyers split between those who buy and those who don’t (who rent). Default: 50% who could buy, do Buyers Renters Calculation 3: Renters split between market rent, intermediate rent and social rent based on comparison of income against rental price Buyers Private Renters Intermediate Housing Social Renters Default: 35% of income on 30th percentile rent Default: 25% of income on median rent