Download
1 / 22
220 likes | 372 Vues
Investigate a situation involving elements of chance using a simulation. Investigate situations that involve elements of chance: calculating probabilities using such tools as simulations and technology. designing a simulation for a given situation identifying tools to be used

E N D
Investigate a situation involving elements of chance using a simulation
Investigate situations that involve elements of chance:calculating probabilities using such tools as simulations and technology • designing a simulation for a given situation • identifying tools to be used • defining a trial and the number of trials • determining data recording methods • carrying out the simulation and record outcomes • selecting and using appropriate displays and measures • communicating findings in a conclusion.
What are the chances? NEW ZEALAND undefeated at soccer world cup 2010
At the 2010 soccer world cup 145 goals were scored from 566 shots on goal over 32 games. How many shots per game? What is the probability that a shot goes in?
18 shots per game, on average1 in 4 shots goes in, on average We can simulate the tournament using these 2 statistics. Each person has one team. To play a game, each person simulates 9 shots on goal. 4 sided dice? Calculator? Spinner? tokens in a cup?
Play a game In the soccer world cup, there are 8 pools of 4 teams each. Play a (simulated) game against someone in your pool (A to H) Each player must simulate 9 shots on goal, and count the number of successful goals. The team with the larger number of goals is the winner. Record the score, then play against someone else in your pool.
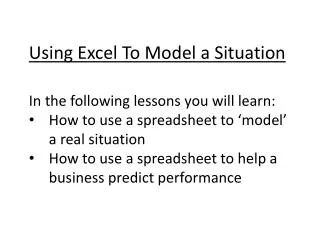
Making the simulation easier Each team has to play each other team in the pool, and the teams are then ranked on the results. The top 2 teams from each pool will go forward in the competition. We will need to play a lot of games. Using Excel, we can repeat the simulation much more quickly.
Using Excel for simulations Simulations can be done with just a few commands in Excel =randbetween ( , ) =if( , , ) =sum( )
At the bottom of each column use =sum( ) to total the goals for that team
Now playing a game is as simple as deciding which team is A, which team is B, and pressing F9 to rerandomise.
Each team plays each other team in the pool once. 3 points for a win, 1 for a draw, 0 for a loss. Play your pool games and rank your teams. The top 2 games in each pool move on to the next round.
What assumptions did we make?What limitations apply to our model? How could we improve our simulation to make it better represent a replaying of the actual World Cup tournament? What information would we need? What tool would we use to do the simulation?
What other situations could be simulated? Anything that has an unpredictable element can be simulated. Games are often simulations or can be simulated. Business plans can incorporate unpredictable factors. Many interactive simulations on websites can be used for inspiration. You do need some statistics or known probabilities to begin.
How reliable are political polls? Political polls often survey about 750 people. If the actual support for the different parties is 50% National, 30% Labour, 10% Green, 10% other, what sort of variation might we expect to see from one poll to the next?
Use =countif(array,value) to count supporters for each party
Make a graph of the % results Press F9 to redo the poll with another 750 people How much difference would you need to see before you could conclude that people’s preferences really have changed? By repeating the poll (filling sideways) you can graph repeated polling over time.
What would you like to simulate? The morning traffic? The stock market? The side effects of power generation?