Download

1 / 7
0 likes | 0 Vues
A Power BI manufacturing dashboard helps you see everything in one place. It turns complex factory data into simple charts and visuals that are easy to understand. Instead of guessing what is happening, you can see the truth instantly.<br>

E N D
POWER BI MANUFACTURING DASHBOARD
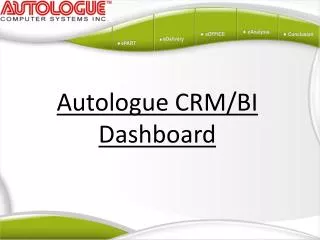
In manufacturing, every minute matters. A small delay in production, a machine breakdown, or extra inventory can reduce profits quickly. That is why companies today need more than simple reports. They need clear, real-time insights. A Power BI manufacturing dashboard helps you see everything in one place. It turns complex factory data into simple charts and visuals that are easy to understand. Instead of guessing what is happening, you can see the truth instantly. What Is a Power BI Manufacturing Dashboard? A Power BI manufacturing dashboard is a smart visual report that shows important production and business data in real time. It connects data from machines, ERP systems, Excel files, and other sources. The goal is simple: Make decision-making fast, clear, and accurate. With the right manufacturing dashboard KPI, managers and CEOs can track performance without reading long reports.
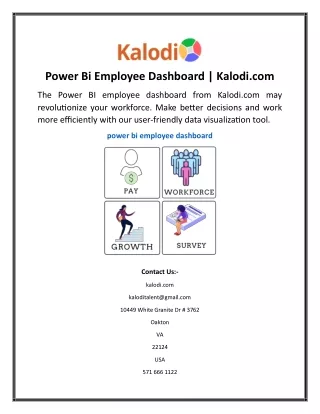
WHY MANUFACTURING COMPANIES NEED IT Manufacturing operations are complex. There are machines running 24/7, workers on different shifts, suppliers delivering materials, and customers waiting for orders. Without proper tracking, problems stay hidden. A strong manufacturing KPI dashboard helps you: Monitor daily production Reduce downtime Control costs Improve quality Manage inventory better Using business intelligence for manufacturing, companies move from reactive management to proactive control.
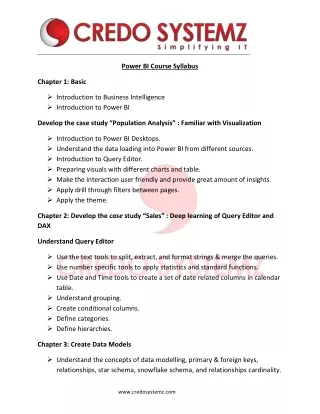
KEY METRICS IN A MANUFACTURING DASHBOARD A good Power BI manufacturing dashboard focuses on the numbers that truly matter. 1. Production Performance Track output vs target, shift performance, and delays. This helps ensure production goals are met consistently. 2. Machine Efficiency (OEE) Measure availability, performance, and quality. This important manufacturing dashboard KPI shows how well machines are working. 3. Inventory Levels Monitor raw materials and finished goods. This prevents overstocking or shortages. 4. Quality Metrics Track defect rates and rejection levels to maintain product standards. 5. Financial Data See revenue, cost per unit, and profit margins in one place. These insights from Power BI for manufacturing help leaders take quick and smart action.
Benefits of Using Power BI in Manufacturing A well-designed Power BI manufacturing dashboard offers many advantages: Real-time data updates Easy-to-read visuals Better team collaboration Faster decision-making Reduced operational risk Instead of waiting for monthly reports, managers can solve problems immediately. This is the true power of manufacturing data analytics. How It Improves Decision-Making Imagine starting your day by opening one dashboard and seeing: Today’s production status Machine downtime Inventory health Quality performance Profit trends
Final Thoughts A smart Power BI manufacturing dashboard gives you complete visibility over production, machines, inventory, quality, and finance. By tracking the right manufacturing dashboard KPI, companies reduce waste, improve performance, and grow faster.