
INTRODUCTION
Detection of Entorhinal Islands with High Field, High Resolution in Ex Vivo Magnetic Resonance Imaging. Jean C. Augustinack 1 , Andre J.W. van der Kouwe 1 , Megan Blackwell 1 , David H. Salat 1 , Graham Wiggins 1 , Chris Wiggins 1 , Larry Wald 1 , Bruce Fischl 1,2

INTRODUCTION
E N D
Presentation Transcript
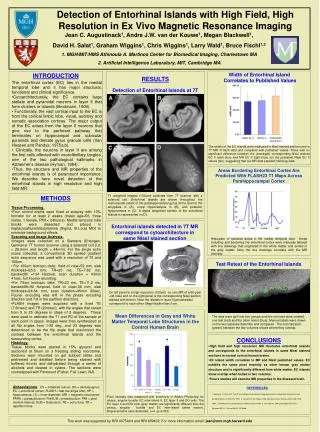
Detection of Entorhinal Islands with High Field, High Resolution in Ex Vivo Magnetic Resonance Imaging Jean C. Augustinack1, Andre J.W. van der Kouwe1, Megan Blackwell1, David H. Salat1, Graham Wiggins1, Chris Wiggins1, Larry Wald1, Bruce Fischl1,2 1. MGH/MIT/HMS Athinoula A. Martinos Center for Biomedical Imaging, Charlestown MA 2. Artificial Intelligence Laboratory, MIT, Cambridge MA Width of Entorhinal Island Correlates to Published Values INTRODUCTION RESULTS • The entorhinal cortex (EC) lies in the medial temporal lobe and it has major structural, functional and clinical significance. • Cytoarchitecturally, the EC contains large stellate and pyramidal neurons in layer II that form clusters or islands (Brodmann, 1909). • Functionally, the vast cortical input to the EC is from the cortical limbic lobe, visual, auditory and somatic association cortices. The major output of the EC arises from the layer II neurons that give rise to the perforant pathway that terminates on hippocampal and subicular pyramids and dentate gyrus granule cells (Van Hoesen and Pandya, 1975a,b). • Clinically, the neurons in layer II are among the first cells affected with neurofibrillary tangles, one of the two pathological hallmarks in Alzheimer’s disease (Hyman, 1984). • Thus, the structure and MR properties of the entorhinal islands is of paramount importance. We describe here novel detection of the entorhinal islands in high resolution and high field MR. Detection of Entorhinal Islands at 7T The widths of the EC islands were measured in Nissl stained sections and in 7T MR TI flash data and compared with published values. There was no significant difference between the (averaged) corresponding Nissl stained EC II (dark blue) and MR EC II (light blue) nor the published Nissl EC II values (tan), suggesting that our MR data parallels histology data. Areas Bordering Entorhinal Cortex Are Predicted With FLASH23 T1 Maps Across Parahippocampal Cortex T1 weighted images (100um) collected from 7T scanner with a solenoid coil. Entorhinal islands are shown throughout the rostrocaudal extent of the parahippocampal gyrus at the level of the amygdala in (A), uncal hippocampus in (B), and posterior hippocampus in (C). A digital tangential section of the entorhinal islands is represented in (D). METHODS • Tissue Processing. • Four control brains were fixed at autopsy with 10% formalin for at least 2 weeks (mean age=56, three males, 1 female, PMI < 24hours). Medial temporal lobe blocks were dissected and placed in heptacosafluorotributylamine (Sigma, St.Louis MO) to minimize background effects. • Scanning and Image Analysis. • Images were collected on a Siemens (Erlangen, Germany) 7T human scanner using a solenoid coil (i.d. = 28.5mm and length = 44mm). For the single echo scans collected, a conventional 3D spoiled gradient echo sequence was used with a resolution of 70 and 100um. • For 100um isotropic data: field of view=52 mm, slab thickness=25.6 mm, TR=20 ms, TE=7.82 ms, bandwidth =134 Hz/pixel, scan duration = 43min 41sec, full Fourier encoding. • For 70um isotropic data: TR=23 ms, TE=11.2 ms, bandwidth=92 Hz/pixel, field of view=36 mm, slab thickness=24.64 mm, scan duration=45min 20sec, Fourier encoding was 6/8 in the phase encoding direction and 7/8 in the partition direction). • FLASH images were acquired with a fixed TE (7.8msec) and TR (20msec), with flip angles that varied from 5 to 25 degrees in steps of 5 degrees. These were used to estimate the T1 and PD of the sample at each point in space. Images were then synthesized at all flip angles from 1-90 deg, and 23 degrees was determined to be the flip angle that maximized the contrast between the entorhinal islands and the surrounding cortex. • Histology. • Tissue blocks were placed in 15% glycerol and sectioned at 50um on a freezing sliding microtome. Sections were mounted on gel subbed slides and pretreated and defatted before being stained with buffered thionin and dehydrated through a series of alcohols and cleared in xylene. The sections were coverslipped with Permount (Fisher, Fair Lawn, NJ). Entorhinal islands detected in 7T MR correspond to cytoarchitecture in same Nissl stained section Histogram of selected areas in the medial temporal lobe. Areas including and bordering the entorhinal cortex were manually labeled with line drawings that originated in the white matter and ended in the gray matter. Note the line drawings correlate with the MR intensity. Test Retest of the Entorhinal Islands On left panel is a high resolution (100um) ex vivo MR of a 66-year -old male and on the right panel is the corresponding Nissl section stained with thionin. Note the islands in layer II (arrowheads) correspond to each other. Magnification bar=1cm. Mean Differences in Gray and White Matter Temporal Lobe Structures in the Control Human Brain The data were split into two groups and two volumes were created: one test (red) and the other retest (blue). Manual labels were drawn on the two separate data files and compared. The colocalization (green) between the two volumes shows where they overlap. CONCLUSIONS • High field and high resolution MR illustrates entorhinal islands and corresponds to the entorhinal islands in same Nissl stained sections in normal control human brains. • EC island width correlates to MR and Nissl published values. EC exhibits the same pixel intensity as other known gray matter structure and is significantly different from white matter. EC islands show overlap when tested in two volumes. • Future studies will examine MR properties in the diseased brain. Abbreviations: CS = collateral sulcus; DG = dentate gyrus; EC = entorhinal cortex; FLASH = fast low angle shot; HP = hippocampus; I.D.= inner diameter; MR = magnetic resonance; PARA = parasubiculum; PreSUB = presubiculum; PMI = post mortem interval; SUB = Subiculum; TE = echo time; TR = repetition time. REFERENCES 1. Damasio, H, Kuljis RO, Yuh W, et al, Magnetic Resonance Imaging of Human Intracortical Structure in vivo, Cerebral Cortex (1) 374-379, 1991. 2. Hyman BT, Van Hoesen GW, Damasio A et al, Science (225) 1168-1170, 1984. 3. Brodmann K, Localization of Cerebral Cortex, 1909. 4. Van Hoesen, GW and Pandya DN. Brain Research 95 (1) 1-24 and 39-59, 1975a&b. Pixel intensity was measured with luminosity in Adobe Photoshop for alveus, angular bundle, EC inter-island II, EC layer II and DG cells. The EC layer II and DG cells (gray matter) are significantly different than the alveus, angular bundle and EC inter-island (white matter). Representative case illustrated. n=4. (p<0.001) This work was supported by RR14075A04 and RR1659402. For more information email: jean@nmr.mgh.harvard.edu


