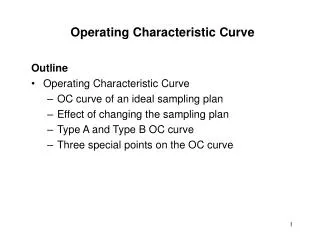
Operating Characteristic (OC) Curves
Operating Characteristic (OC) Curves. Ben M. Coppolo Penn State University. Presentation Overview. Operation Characteristic (OC) curve Defined Explanation of OC curves How to construct an OC curve An example of an OC curve Problem solving exercise. OC Curve Defined .

Operating Characteristic (OC) Curves
E N D
Presentation Transcript
Operating Characteristic (OC) Curves Ben M. Coppolo Penn State University
Presentation Overview • Operation Characteristic (OC) curve Defined • Explanation of OC curves • How to construct an OC curve • An example of an OC curve • Problem solving exercise
OC Curve Defined • What is an Operations Characteristics Curve? • the probability of accepting incoming lots.
OC Curves Uses • Selection of sampling plans • Aids in selection of plans that are effective in reducing risk • Help keep the high cost of inspection down
OC Curves • What can OC curves be used for in an organization?
Types of OC Curves • Type A • Gives the probability of acceptance for an individual lot coming from finite production • Type B • Give the probability of acceptance for lots coming from a continuous process • Type C • Give the long-run percentage of product accepted during the sampling phase
OC Graphs Explained • Y axis • Gives the probability that the lot will be accepted • X axis =p • Fraction Defective • Pf is the probability of rejection, found by 1-PA
Definition of Variables PA = The probability of acceptance p = The fraction or percent defective PF or alpha = The probability of rejection N = Lot size n = The sample size A = The maximum number of defects
OC Curve Calculation • Two Ways of Calculating OC Curves • Binomial Distribution • Poisson formula • P(A) = ( (np)^A * e^-np)/A !
OC Curve Calculation • Binomial Distribution • Cannot use because: • Binomials are based on constant probabilities. • N is not infinite • p changes • But we can use something else.
OC Curve Calculation • A Poisson formula can be used • P(A) = ((np)^A * e^-np) /A ! • Poisson is a limit • Limitations of using Poisson • n<= 1/10 total batch N • Little faith in probability calculation when n is quite small and p quite large. • We will use Poisson charts to make this easier.
Calculation of OC Curve • Find your sample size, n • Find your fraction defect p • Multiply n*p • A = d • From a Poisson table find your PA
N = 1000 n = 60 p = .01 A = 3 Find PA for p = .01, .02, .05, .07, .1, and .12? Calculation of an OC Curve
Properties of OC Curves • Ideal curve would be perfectly perpendicular from 0 to 100% for a given fraction defective.
Properties of OC Curves • The acceptance number and sample size are most important factors. • Decreasing the acceptance number is preferred over increasing sample size. • The larger the sample size the steeper the curve.
Properties of OC Curves • By changing the acceptance level, the shape of the curve will change. All curves permit the same fraction of sample to be nonconforming.
Example Uses • A company that produces push rods for engines in cars. • A powdered metal company that need to test the strength of the product when the product comes out of the kiln. • The accuracy of the size of bushings.
Problem • MRC is an engine company that builds the engines for GCF cars. They are use a control policy of inspecting 15% of incoming lots and rejects lots with a fraction defect greater than 3%. Find the probability of accepting the following lots:
Problem • A lot size of 300 of which 5 are defective. • A lot size of 1000 of which 4 are defective. • A lot size of 2500 of which 9 are defective. • Use Poisson formula to find the answer to number 2.
Summary • Types of OC curves • Type A, Type B, Type C • Constructing OC curves • Properties of OC Curves • OC Curve Uses • Calculation of an OC Curve
Bibliography Doty, Leonard A. Statistical Process Control. New York, NY: Industrial Press INC, 1996. Grant, Eugene L. and Richard S. Leavenworth. Statistical Quality Control. New York, NY: The McGraw-Hill Companies INC, 1996. Griffith, Gary K. The Quality Technician’s Handbook. Engle Cliffs, NJ: Prentice Hall, 1996. Summers, Donna C. S. Quality. Upper Saddle River, NJ: Prentice Hall, 1997. Vaughn, Richard C. Quality Control. Ames, IA: The Iowa State University, 1974.