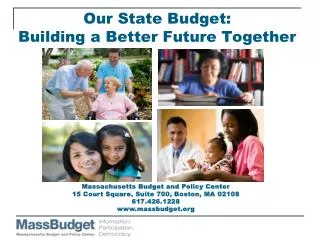
Our State Budget: Building a Better Future Together
330 likes | 491 Vues
Our State Budget: Building a Better Future Together. Massachusetts Budget and Policy Center 15 Court Square, Suite 700, Boston, MA 02108 617.426.1228 www.massbudget.org. Education. Transportation. Libraries, Parks and Recreation. Public Safety . Clean Air and Safe Drinking Water .

Our State Budget: Building a Better Future Together
E N D
Presentation Transcript
Our State Budget: Building a Better Future Together Massachusetts Budget and Policy Center 15 Court Square, Suite 700, Boston, MA 02108 617.426.1228 www.massbudget.org
Mass. Taxes are Lower than U.S. Average US 10.4% MA 9.8%
Why We are Called “Taxachusetts” State and local taxes as % of personal income, Fiscal Year 1977 MA 13.8% US 11.4%
Mass. Taxes Declined Most: 1977- 2009 US 8.1% Decrease MA 29.2% Decrease
State Spending Declined Somewhat Local Aid Law & Pub. Safety. Econ. Dev. & Infrastructure Env. & Rec.
State Tax Revenues Declined ~$3 Billion 6.3% 5.3% Corporate Tax (-$332 million)
Revenue Plunges in FY09 as Recession Hits *Final collection total (from Auditor’s revenue report) includes only those tax categories counted in the official Consensus Revenue Estimate.
Closing the Budget Gaps: FY10-FY12 Total Gap: $5 billion Billions Total Gap: $2.7 billion Total Gap: $1.9 billion
How big is the fiscal year 2013 budget gap? Rough Calculations 550 million – 266 million + 1.01 billion = 1.29 billion one-time FY12 FY13 revenue growth cost growth Projected Deficit revenue not available (inflation) for FY13 This estimate uses DOR revenue estimates, MassBudget spending estimates $2.23 billion
How does the Governor fill a $1.3 billion gap for FY 2013? • Rainy Day Fund: $400 mil • Proceeds from various trust funds • Cigarette tax up $0.50: $63 mil • Sales tax for candy and soda: $62 mil • Enhanced tax enforcement: $22 mil • Bottle redemption: $22 mil
Chapter 70 Education Aid • Gov’s FY13 Proposal Notes: • CH70 up $145.6 mil, but somewhat less when considering federal Ed. Jobs money Billions, Inflation Adjusted Includes ARRA funding; Adjusted using the inflation factor identified in Chapter 70
Local Aid • Gov’s FY13 Proposal Notes: • Unrestricted General Gov’t Aid cut of $65 million could be reversed with sufficient FY12 surplus funds Billions, Inflation Adjusted
Early Education and Care • Gov’s FY13 Proposal Notes: • Child Care subsidies cut $8.1 million Millions, Inflation Adjusted
Higher Education • Gov’s FY13 Proposal Notes: • Major Community College governance changes coupled with increase of $14.4 million Billions, Inflation Adjusted
Public Health • Gov’s FY13 Proposal Notes: • Sales tax revenue from soda and candy used to fend off deeper public health cuts Millions, Inflation Adjusted
Human Services Billions, Inflation Adjusted
Mental Health 15% decrease since FY01 But some costs shifted Millions, Inflation Adjusted
Environment and Recreation Millions, Inflation Adjusted 20% decrease since FY01
Weaker relationship between education and wages 30 years ago
Many Program Areas Have Seen Substantial Cuts Over The Last Ten Years What We Do Together Through Government