Download
1 / 18
190 likes | 196 Vues
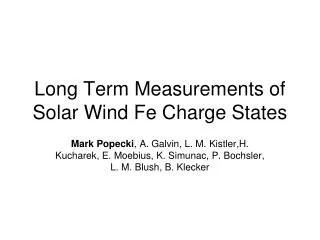
Long Term Measurements of Solar Wind Fe Charge States. Mark Popecki , A. Galvin, L. M. Kistler,H. Kucharek, E. Moebius, K. Simunac, P. Bochsler, L. M. Blush, B. Klecker. slow. fast. Von Steiger et al., (2000). Solar Wind Fe Charge State Expectations. Four types (Schwenn, 2006)

E N D
Long Term Measurements of Solar Wind Fe Charge States Mark Popecki, A. Galvin, L. M. Kistler,H. Kucharek, E. Moebius, K. Simunac, P. Bochsler, L. M. Blush, B. Klecker
slow fast Von Steiger et al., (2000) Solar Wind Fe Charge State Expectations • Four types (Schwenn, 2006) • Fast solar wind (coronal holes) • Slow solar wind (near helmet streamers • Slow solar wind (active regions) • ICME solar wind • <QFe> slow > <QFe>fast • ICME QFe ~16+ • Small variations in mean charge state compared to SEPs
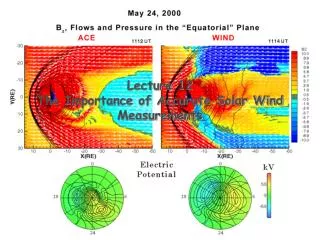
Q Fe STEREO A solar wind speed/100 (km/s) STEREO A Fe Charge States vs. Solar Wind SpeedLatter Half of 2008 • Limited period of time • Solar wind speed is inversely related to Q Fe • Examine a longer period, in solar maximum…
Solar Wind QFe from ACE/SWICS 1998-2008 • Two hour averages of solar wind Fe charge states with a 33 day running average (top) • International Monthly Sunspot number (bottom) • ICME solar wind may have high Fe charge states (Lepri; Reinard (2005, 2008) • Fewer occurrences of high charge state solar wind in 2006-2008. • The mean Fe charge state decreases in 2006-2008.
QFe Histograms: ACE SWICS 1998-2008 QFe is reduced by 2 units from 1998 to 2008
QFe S/W speed/100 <QFe> from ACE/SWICS and Solar Wind Speed from ACE/SWEPAM • Mean ACE Fe charge states: 33 day running averages (top) • Solar wind speed from ACE/SWEPAM (bottom) • The mean solar wind speed sometimes changes without am inverse change in the mean Fe charge state.
2007/143 May 22-24 ICME S/W speed / 100 and < QFe > Iron charge states and solar wind speeds :2007 (DOY 022) -2009 (DOY 230), STEREO A • The top trace is the iron charge state, averaged over 2 hour periods. • The average charge states typically ranged between 8+ and 11+. • A prominent exception occurred during the 2007/143 May 23 ICMEs. The average charge state was ~13+ to 14+. • The bottom trace is the 2 hour averaged solar wind speed from STEREO A. • An upward trend occurred in the beginning of 2008, maximizing at DOY 2007 400 (early February, 2008). • A long decline below the 2007 levels followed, until August of 2009. • Variations in the solar wind speed have decreased compared to early 2007. 2009 2007 2008
QFe S/W speed 2009 2007 2008 Mean Iron Charge State and Solar Wind Speed:2007 (DOY 022) -2009 (DOY 230), STEREO A • The smoothed trendline in the iron charge states is shown in blue (left axis) with the smoothed trendline for the solar wind speed. • The iron charge state tends to move in the opposite direction to the solar wind speed in a large scale sense. • The charge state has not completely recovered to the early 2007 levels, even though the average solar wind speed has gone lower than it was in 2007.
Solar Wind Speeds: Recent Solar Min and Max • STEREO A: 2007/045-2009/230 • ACE: 1998-2005.5 • Speeds in the 2007-2009 period (solar min) are typically lower than the 1998-2005 period (solar max)
15 14 13 12 11 10 9 8 7 6 5 4 3 2 1 0 < QFe > 0 200 400 600 800 Solar Wind Speed (STEREO A, km/s) Solar Wind Speed vs. Iron Charge State STEREO A 2007-2009 • The iron charge states are plotted against corresponding solar wind speeds for the 2007-2009 period. • Variations in charge state are generally related to solar wind speed, but with a broad spread of approximately 1-2 charge units.
375 < S/W speed < 425 km/s <QFe> = 9.2 260 < S/W speed < 310 km/s <QFe> = 9.7 500 < S/W speed < 550 km/s <QFe> = 8.7 700 < S/W speed < 750 km/s <QFe> = 8.6 Iron Charge States for 4 S/W Speed Ranges • Histograms of mean iron charge states are plotted for selected intervals of solar wind speed. • The average charge state declines particularly over the speed range 270-500 km/s, then changes little at higher speeds. • <QFe> decreases by ~1 unit over the entire speed range
NSO/GONG synoptic coronal hole plots for selected Carrington rotations • Red/green areas are coronal holes: red negative polarity, green positive polarity • Neutral line is in black • Isolated coronal holes disappear with time • Polar coronal hole extensions shrink • Neutral line flattens (less tilted current sheet) Galvin et al., 2009
Iron Charge States vs. S/W Speed2007-2009 • One hour sampling intervals are shown. • Transient or ICME intervals are highlighted (Kilpua et al, 2009 a, b) • Small transients: magnetic structures related to sector boundaries in solar wind • ICME list (Jian, 2009) • Additional ICMEs identified by Kilpua 2009b • Reinard (2005, 2008) related the Fe charge state to the energetics of the originating solar event such as flare magnitude. • No ICMEs occurred with <QFe> near 16+ Galvin et al. (2009)
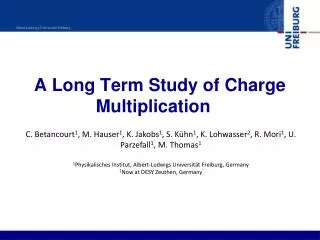
Summary • ACE/SWICS mean Fe charge states have declined in the declining phase of the previous solar maximum by ~2 units (1998-2008). • The decline is partly a result of fewer transient periods of high charge states (fewer ICMEs?) • Fe charge states are anticorrelated with solar wind speed over short periods, but they may be poorly correlated in long term averages. • The mean STA Fe charge state in the 2007-2009 period tends to be higher at low speeds than at high speeds by ~ 1 unit. • Variation of the Fe charge state with speed is small above 500 km/s. • STEREO A mean Fe charge states have varied inversely with solar wind speed in the 2007-2009 period. • Recent Fe charge states are lower for the present low speed regime than they were in 2007. • Is this slow solar wind without the high charge state component (~Fe 16+)?
One hour averages of solar wind speed and iron charge state from STEREO A • Smoothed lines - 655 hour averages (~Carrington rotation)
STEREO A Fe Charge States vs. Solar Wind Speed • Average Fe charge state generally shows an anticorrelation with solar wind speed (sources: fast or slow s/w, coronal holes or active region). • Typical values of charge state are between 9+ and 10+. • Only one period of high charge states exists: May 22-24, 2007 (ICME).