
Introduction
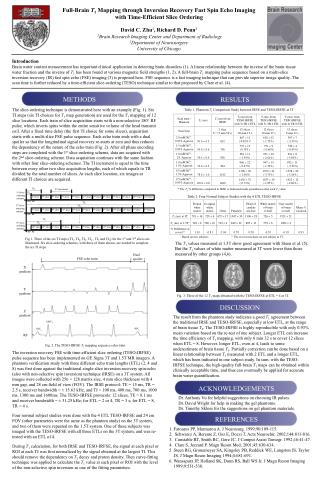
METHODS. DISCUSSION. RESULTS. 1 st slice. 3 rd slice. 5 th slice. 7 th slice. 9 th slice. 11 th slice. 2 nd slice. 4 th slice. 6 th slice. 8 th slice. 10 th slice. 12 th slice. 5 st slice. 7 th slice. 9 th slice. 11 th slice. 2 nd slice. 4 th slice.

Introduction
E N D
Presentation Transcript
METHODS DISCUSSION RESULTS 1st slice 3rd slice 5th slice 7th slice 9th slice 11th slice 2nd slice 4th slice 6th slice 8th slice 10th slice 12th slice 5st slice 7th slice 9th slice 11th slice 2nd slice 4th slice 6th slice 8th slice 10th slice 12th slice 1st slice 3rd slice ACKNOWLEDGEMENTS REFERENCES 10th slice 12th slice 1st slice 3rd slice 5th slice 7th slice 9th slice 11th slice 2nd slice 4th slice 6th slice 8th slice Dual spoiler FSE echo train X gradient Y gradient Z gradient 180y 90y 90x RF Fig. 2. The TESO-IRFSE T1 mapping sequence echo train. Full-Brain T1 Mapping through Inversion Recovery Fast Spin Echo Imaging with Time-Efficient Slice Ordering David C. Zhu1, Richard D. Penn2 1Brain Research Imaging Center and Department of Radiology 2Department of Neurosurgery University of Chicago Introduction Brain water content measurement has important clinical application in detecting brain disorders (1). A linear relationship between the inverse of the brain tissue water fraction and the inverse of T1 has been found at various magnetic field strengths (1, 2). A full-brain T1 mapping pulse sequence based on a multi-slice inversion recovery (IR) fast spin echo (FSE) imaging (3) is proposed here. FSE sequence is a fast imaging technique that can provide superior image quality. The scan time is further reduced by a time-efficient slice-ordering (TESO) technique similar to that proposed by Clare et al. (4). The slice-ordering technique is demonstrated here with an example (Fig. 1). Six TI steps (six TI choices for T1 map generation) are used for the T1 mapping of 12 slice locations. Each train of slice acquisition starts with a non-selective 180 RF pulse, which inverts spins within the entire sensitive volume of the head transmit coil. After a fixed time delay (the first TI choice for some slices), acquisition starts with a multi-slice FSE pulse sequence. Each echo train ends with a dual spoiler so that the longitudinal signal recovery re-starts at zero and thus reduces the dependency of the nature of the echo train (Fig. 2). After all phase encoding steps are completed with the 1st slice-ordering scheme, data are acquired with the 2nd slice-ordering scheme. Data acquisition continues with the same fashion with other four slice-ordering schemes. The TI increment is equal to the time between every other two slice acquisition lengths, each of which equals to TR divided by the total number of slices. At each slice location, six images at different TI choices are acquired. Table 1. Phantom T1 Comparison Study between IRSE and TESO-IRFSE at 3T * The T1 % difference compared to IRSE is indicated inside parentheses after each T1 value TI1 TI increment 1st slice-ordering scheme TI1 Table 2. Four Normal Subject Studies with the 4 ETL TESO-IRFSE 180 RF TI6 2nd slice-ordering scheme TI6 180 RF TI2 TI2 6th slice-ordering scheme 180 RF + Based on two subjects. ++ The re-test was done on one subject at 3T. Fig 1. Three of the six TI steps (TI1, TI2, TI3, TI4 , TI5 and TI6) for the 1st and 3rd slices are illustrated. Six slice-ordering schemes, with three of them shown, are needed to complete the six TI steps. The T1 values measured at 1.5T show good agreement with Steen et al. (5). But the T1 values of white matter measured at 3T were lower than those measured by other groups (4,6). Fig. 3. Three of the 12 T1 maps obtained with the TESO-IRFSE at ETL = 4 at 3T. The result from the phantom study indicates a good T1 agreement between the traditional IRSE and TESO-IRFSE, especially at low ETL, at the range of brain tissue T2. The TESO-IRFSE is highly reproducible with only 0.93% mean variation based on the re-test of one subject. Longer ETL can increase the time efficiency of T1 mapping, with only 6 min 32 s to cover 12 slices when ETL = 8. However, longer ETL, even at 4, leads to some underestimate of brain tissue T1. Partially correction can be done based on a linear relationship between T1 measured with 2 ETL and a longer ETL, which has been indicated in one subject study. In sum, with the TESO-IRFSE technique, the high-quality full-brain T1 maps can be obtained within clinically acceptable time, and thus can eventually be applied for accurate brain water quantification. The inversion recovery FSE with time-efficient slice ordering (TESO-IRFSE) pulse sequence has been implemented on GE Signa 3T and 1.5T MR imagers. A phantom verification study with three different echo train lengths (ETL) (2, 4 and 8) was first done against the traditional single-slice inversion recovery spin-echo (also with non-selective spin inversion) technique (IRSE) on a 3T system. All images were collected with 256 × 128 matrix size, 4 mm slice thickness with 4 mm gap, and 28 cm field of view (FOV). The IRSE protocol: TE = 15 ms, TR = 2.5 s, receiver bandwidth = ± 15.63 kHz, and TI = 100 ms, 400 ms, 700 ms, 1000 ms, 1300 ms and 1600ms. The TESO-IRFSE protocols: 12 slices, TE = 8.1 ms and receiver bandwidth = ± 31.25 kHz; for ETL = 2 or 4, TR = 3 s; for ETL = 8, TR = 4 s. Four normal subject studies were done with the 4 ETL TESO-IRFSE and 24 cm FOV (other parameters were the same as the phantom study) on the 3T system, and two of them were repeated on the 1.5T system. One of these subjects was imaged with the TESO-IRFSE with all three ETLs on the 3T system, and was re-tested with an ETL of 4. During T1 calculation, for both IRSE and TESO-IRFSE, the signal at each pixel or ROI at each TI was first normalized by the signal obtained at the largest TI. This should remove the dependency on T2 decay and proton density. Then curve-fitting technique was applied to calculate the T1 value at each pixel or ROI with the level of the non-selective spin inversion as one of the fitting parameters. Dr. Anthony Vu for helpful suggestions on choosing IR pulses. Dr. David Wright for help in making the gel phantoms. Dr. Timothy Skloss for the suggestions on gel phantom materials. • Fatouros PP, Marmarou A. J Neurosurg. 1999;90:109-115. • Schwarcz A, Berente Z, Osz E, Doczi T. Acta Neurochir. 2002;144:811-816. • Constable RT, Smith RC, Gore JC. J Comput Assist Tomogr. 1992;16:41-47. • Clare S, Jezzard P. Magn Reson Med. 2001;45:630-634. • Steen RG, Gronemeyer SA, Kingsley PB, Reddick WE, Langston JS, Taylor JS. J Magn Reson Imaging 1994;4:681-691. • Wansapura JP, Holland SK, Dunn RS, Ball WS Jr. J Magn Reson Imaging 1999;9:531-538.


