Download

1 / 70
700 likes | 925 Vues
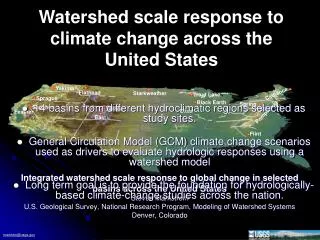
Water Quality Study In the Streams of Flint Creek and Flint River Watersheds For TMDL Development. Idris Abdi Doctoral Dissertation Presentation Major Advisor: Dr. Teferi Tsegaye April 18, 2005 Alabama A & M University. Presentation Order. Introduction Statement of the Problem

E N D
Water Quality Study In the Streams of Flint Creek and Flint River Watersheds For TMDL Development Idris Abdi Doctoral Dissertation Presentation Major Advisor: Dr. Teferi Tsegaye April 18, 2005 Alabama A & M University
Presentation Order • Introduction • Statement of the Problem • Research Hypothesis • Objectives of the Study • Materials and Methods • Results and Discussion • Conclusion Questions, Comments, & etc.
Introduction • Water is essential to everyone. Thus no matter where we live, we like our water bodies (lakes, rivers, and streams ) to be clean, clear, and fresh. Therefore, healthy water bodies are central to people’s lives. Every one wants to see pristine, clean, and unpolluted water to fish on or swim in. • Pollutant discharges from non-point sources are less controlled and are also adversely affecting water quality. • The US EPA reported that agricultural discharges affect 72% of the impaired river areas, 57% of the impaired lake area, and 43% of the estuarine areas (US EPA).
Introduction… • Point source discharges are regulated by the CWA through administration of the National Pollutant Discharge Elimination System (NPDES). Point source pollution have been significantly reduced since this program started.
Watershed..? • Watershed is an area of land which drains to a common point. Watersheds can range in size from a few acre to thousands of square miles. • A basin (or drainage basin) is the area of land drained by a river or lake and its tributaries. Each drainage basin is made up of smaller units called watersheds.
TMDL … ? • TMDL determines the greatest amount of a given pollutant that a water body can receive without violating water quality standards and designated uses. • By taking a watershed approach, a TMDL considers all potential sources of pollutants, both point and non-point sources. It also takes into account a margin of safety, which reflects scientific uncertainty and future growth.
TMDL … • In short, a TMDL is calculated using the following equation: • TMDL = WLA +LA + MOS • Where: WLA=Waste Load Allocation (point sources)LA = Load Allocation (non-point sources)MOS = Margin of Safety • A TMDL can also be defined as a reduction in pollutant loading that results in meeting water quality standards.
Statement Of The Problem • Water quality study in the Flint Creek and Flint River watersheds, in north Alabama due to both point and non-point sources resulting from spatial and temporal variability are not fully assessed and well documented. • Effects of non-point source pollution in specific streams in watersheds resulting from spatial and temporal variability may pose a significant challenge to water quality.
Statement Of The Problem . . . • A significant drop in water quality at the Flint Creek and Flint River watersheds due to NPS can impact drinking water supplies, recreation, fisheries, aquatic species, and wild life. • Presence of nutrients, bacteria, and heavy metals can adversely affect the health of aquatic species and human in these two watersheds. • The Clean Water Act, section 303, set by U.S. EPA establishes the water quality standards and TMDL programs. This program mandates states to conduct statewide water quality assessment and identify the water bodies that do not meet water quality standards set forth both at the state and national levels.
Research Hypothesis … 1. Water quality pollution levels will not be different between the two watersheds. 2. Seasonal differences will not have a significant effect in water quality pollutant levels in watersheds. 3. Location will not have an effect in water quality pollutant levels. 4. Most water quality parameters will exceed the concentration levels of the standard set by environmental protection agency (EPA) or Alabama Department of Environmental Management (ADEM) for a given period of time.
OBJECTIVES OF THE STUDY i Examine and compare the spatial and temporal variability of water quality parameters between the water bodies in the Flint Creek and the Flint River watersheds. ii Investigate the effects of land use / land cover, rainfall, and temperature variations on pollutant levels in both watersheds. iii Finally, provide vital information on the trends of water quality in the Flint Creek and Flint River watersheds that could be used for future TMDLs development for these two watersheds.
Objectives of the Study… • Thus, we investigated the effects of • Season • year • Watershed • location
Parameters of Interest i.Total nitrogen (TN). • Total Phosphorus (TP) • Coliform Bacteria • BOD • DO • pH • Turbidity • Temperature • Chlorophyll • Cd • Cr • Ni • Pb • Zn
Materials And MethodsProject Background & Approaches • The study areas chosen for this project are FC and FR Ws, which are located in the Wheeler Lake basin, in north Alabama. • FC is a major tributary to the Wheeler Reservoir and the Tennessee River. The FC Watershed encompasses approximately 117,441 hectares in three counties: Morgan, Lawrence and Cullman.
Map of Wheeler lake basin showing the Flint Creek and Flint River watersheds.
Materials and Methods … • Similar to other north Alabama watersheds, FC absorbs a large amount of residential waste, agricultural runoff, and discharges from municipal sewage (The Flint Creek Watershed Project 1996).
Sampling Locations at the FC Watershed Map of FC watershed showing sampling Locations
Materials and Methods … • The FRW includes approximately 147,151 hectares, including half of Madison County (USGS 1999-2000). • This one starts in Lincoln County, Tennessee, is bounded by the mountains on the east border of Madison County, and drains into the Tennessee River. • It is also primarily agricultural land (U.S. Geological Survey, 2002). • The FRW is an important recreational and scenic resource.
Materials and Methods … Map of FR watershed showing sampling locations
Data Collection and Analysis • Data collection and analysis consisted of acquiring spatial and temporal data, field data, and laboratory data.
Materials and Methods … • An analysis of variance (ANOVA) was performed for all indicator variables. The general linear model (GLM) procedure of statistical analysis system (SAS) version 8.2 (SAS Institute, 2001) was used to rank and evaluate the concentrations of pollutants in the two study areas.
Materials and Methods … • As you have seen in the previous slides, six sampling sites were selected for detailed analysis in both the FC and the FR Ws. • Field data and surface water samples were collected and analyzed every two weeks during the evaluation period
Materials and Methods … • Standard methods and techniques found in the Standard Methods for the Examination of Water and Wastewater (Greenberg, et al., 2000) were used for determination of all parameters.
Rainfall data for 2003 and 2004 at the FC and FR watersheds 110.2 116.2 2003 rainfall data @ the FCW 2003 rainfall data @ the FRW 113.5 125.6 2004 rainfall data @ the FCW 2004 rainfall data @ the FRW
Results and Discussion … • Annual mean precipitation for 2003 at the FCW was 110.2mm, while FRW had 116.2 mm annual precipitation for the same period. • Annual mean precipitation for 2004 at the FCW was 113.5 mm, while FRW had 125.6 mm annual precipitation for the same period. • Rainfall data suggests that Flint River had slightly higher rainfall precipitation for both 2003 and 2004.
Temperature data at the FC and FR Watersheds Temperature data @ the FRW for 2003. Temperature data @ the FCW for 2003. Temperature data @ the FCW for 2004 Temperature data @ the FRW for 2004.
Results… Land use / cover classification map for FC
Results… Land use / cover classification map for FR
Land use/land cover characteristics at the Flint Creek and Flint River watersheds for 2002.
Percent land uses at the Flint Creek and Flint River watersheds
Results and Discussion ( TN ) … Flint Creek Flint River
Results and Discussion… • The highest TN seen in the winter and summer months than the spring and fall months may have been influenced by the heavy rain seen during those months. • The seasonal changes that results in changes in rainfall, hydrologic conditions and other physiologic conditions may play significant role in nutrient washoffs from these watersheds.
Mean BOD5 and DO compared by watershed Flint Creek Flint Creek Flint River Flint Creek Flint River Flint Creek
Mean chlorophyll concentrations compared by watershed Flint Creek Flint River
Mean turbidity (NTU) compared by watershed Flint River Flint Creek