
The Impact of I3C on ERα and GATA3 Expression in T47D Breast Cancer Cells
This study investigates the effects of indole-3-carbinol (I3C) on the downregulation of estrogen receptor alpha (ERα) and GATA3 in hormone-sensitive T47D breast cancer cells. We demonstrate that I3C induces a significant downregulation of GATA3 protein expression at concentrations of 150 µM while failing to downregulate ERα, unlike other compounds such as tryptophol and DIM. Western blot analyses alongside RT-PCR indicate the underlying molecular interactions between I3C and hormonal regulation pathways. This research contributes to the understanding of compound-induced gene expression alterations in breast cancer.

The Impact of I3C on ERα and GATA3 Expression in T47D Breast Cancer Cells
E N D
Presentation Transcript
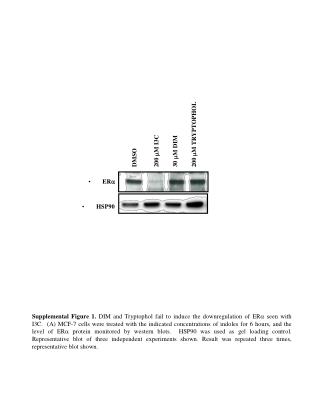
200 M TRYPTOPHOL • 30 M DIM • 200 M I3C • DMSO • ER • HSP90 Supplemental Figure 1. DIM and Tryptophol fail to induce the downregulation of ER seen with I3C. (A) MCF-7 cells were treated with the indicated concentrations of indoles for 6 hours, and the level of ER protein monitored by western blots. HSP90 was used as gel loading control. Representative blot of three independent experiments shown. Result was repeated three times, representative blot shown.
PROTEIN M I3C 0 50 100 200 300 GATA3 ER HSP90 M I3C 0 50 100 200 300 RNA GATA3 ER GAPDH Supplemental Figure 2. The observed half-maximal downregulation of GATA3 is 150 M I3C. MCF7 cells were treated with increasing concentrations of I3C for 48 hr. GATA3 and ER protein was monitored by western blot analysis (upper panels), and GATA3 and ER transcript expression was determined by RT-PCR (lower panels). The PCR products were visualized on a 1% agarose gel stained with ethidium bromide. HSP90 provided a loading control for the western blots and GAPDH provided a gel loading control for the RT-PCR. Results were repeated twice.
A B T47D MG132 - - + + T47D 200 M I3C - + - + 200 M I3C - + GATA3 GATA3 ER ER HSP90 HSP90 C D neo GATA3 GATA3-KRR GATA3 RLU/G PROTEIN ER HSP90 CMV-neo + pER-3561 CMV-GATA3 + pER-3561 Supplemental Figure 3. Effects of I3C on the expression of GATA3 protein and involvement in ER promoter downregulation in hormone sensitive T47D breast cancer cells. (A) T47D cells were treated with the indicated combinations of 200 M I3C and 5 mM MG132 (a 26S proteasome inhibitor) for 6 hours, and the level of ER and GATA3 protein monitored by western blots. HSP90 was used as gel loading control. Densitometry numbers are the ratio of ERto loading control, normalized to the DMSO ratio. (B) T47D cells were treated with or without 200M I3C for 48 hrs. Total cell lysates were electrophoretically fractionated and analyzed by Western blots for the levels of GATA3, ER, and Actin (loading control) protein. (C) T47D cells were transfected with empty vector control (neo), CMV-GATA3, or a dominant negative GATA3 construct (GATA3-KRR). Cells were harvested 72 hrs post transfection, and the levels of ER, GATA3 and HSP90 (loading control) were measured by western blot. (D) T47D cells were cotransfected with the I3C-responsive -3561 bp fragment of the ER promoter linked to a luciferase reporter plasmid along with either CMV-GATA3 or CMV-Neo (vector control). At 24 hours post-transfection, cells were treated with or without 200 M I3C for 24 hours, and the relative luciferase activity was evaluated in lysed cells using the Promega Luciferase Assay Kit. Two additional controls (data not shown) included CMV-luciferase to validate transfection efficiency (positive control) and pgl2 to measure background fluorescence (negative control). Bar graphs indicate relative luciferase activity normalized to the protein input. Error bars were derived from the results of two independent experiments.