Download
1 / 12
120 likes | 273 Vues
September 19 & 20, 2007 Item 3.6 Tab 61. Caltrans Intercity Rail Program 2006-07 4 th Quarter Rail Operations Report. Combined Ridership was up 4.5% over prior year’s 4 th quarter. Overall revenues climbed 8.6%, expenses only increased 2.5% compared to the prior year.

E N D
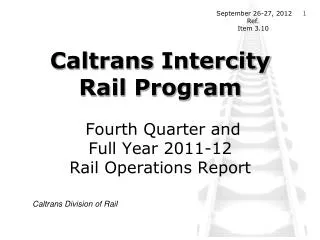
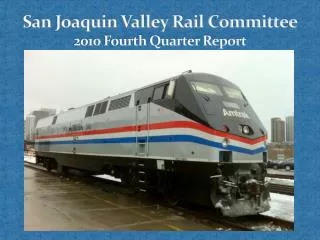
September 19 & 20, 2007 Item 3.6 Tab 61 CaltransIntercity Rail Program 2006-07 4th Quarter Rail Operations Report
Combined Ridership was up 4.5% over prior year’s 4th quarter. Overall revenues climbed 8.6%, expenses only increased 2.5% compared to the prior year. Farebox ratio was 53.6%--2.9% above last year’s ratio. On-time performance was 77.2%--2.4% higher than last year. STATEWIDE OVERVIEW—4th Quarter
STATEWIDE OVERVIEW—4th Quarter Performance Indicators
Combined ridership was up 3.1% over 2005-06 fiscal year. Combined revenues climbed 9.2%, while expenses increased 9.6% compared to 2005-06. Farebox ratio, as a result, dipped slightly to 49.6%--0.2% below last year’s ratio. On-time performance was 72.8%--0.4% higher than 2005-06. STATEWIDE OVERVIEW—State Fiscal Year
STATEWIDE OVERVIEW—2006-07 State Fiscal Year Performance Indicators
Ridership was up 1.1% over prior year’s 4th quarter. Monthly records were set this last May and June. Revenues climbed 9.0%, expenses declined 8.6% compared to the prior year. Farebox ratio climbed to 66.5%--10.7% above last year. On-time performance was 75.6%--2.0% below last year. Pacific Surfliner Route—4th Quarter
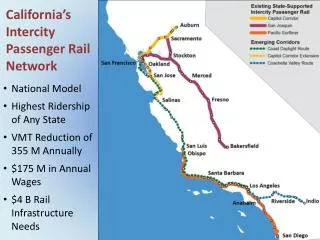
Ridership was up 1.1% over prior year—but was 3.1% below Business Plan Goal Revenues climbed 9.6%, expenses only grew 4.7% compared to the prior year. Farebox ratio climbed to 59.1%--2.6% above last year’s ratio but under the 60.9% Business Plan Goal. On-time performance was 74.8%--2.1% below last year’s performance. Pacific Surfliner Route—2006-07
Ridership down 2.3% compared to prior year’s 4th quarter. Revenues dipped 0.9% and expenses climbed 6.3% compared to the prior year. Farebox ratio dropped to 46.7%--3.4% below last year’s 50.1% ratio. On-time performance was 74.8%--12.1% better than last year’s 4th Quarter. San Joaquin Route—4th Quarter
Ridership dropped 1.4% and was 6.9% below Business Plan Goal. Revenues grew 3.8%, while expenses increased 9.2% compared to the prior year. Farebox ratio declined to 44.5%--2.3% below last year’s ratio and 7.3% below the 51.8% Business Plan Goal. On-time performance was 70.5%--11.6% better than last year. San Joaquin Route—2006-07
Ridership continues strong growing 16.0% compared to prior year’s 4th quarter resulting from increased frequencies. Revenues climbed 23.3% while expenses climbed 20.3% compared to the prior year. Both figures reflect the increased frequencies. Farebox ratio improved to 41.9%--1.0% above last year’s ratio. On-time performance was 79.5%--1.2% better than last year’s 4th Quarter. Best in 8 quarters. Capitol Corridor—4th Quarter
Ridership climbed 10.3% to 1.4 million reflecting the increased frequencies implemented last August. Revenues grew 16.9%, while expenses increased 20.1% compared to the prior fiscal year, both reflecting the increased frequency. Farebox ratio declined slightly to 39.5%--1.1% below last year’s ratio and 5.8% below the 45.4% Business Plan Goal. On-time performance was 72%--2.6% less than last year’s performance. Capitol Corridor—2006-07