Download
1 / 17
170 likes | 292 Vues
Re evaluating the Categorization of HIV Progression in Subjects Based on CD4 T cell Decline Rates. Angela Garibaldi & Ryan Willhite Loyola Marymount University BIOL 398-01/S10 March 2, 2010. Outline.

E N D
Re evaluating the Categorization of HIV Progression in Subjects Based on CD4 T cell Decline Rates Angela Garibaldi & Ryan Willhite Loyola Marymount University BIOL 398-01/S10 March 2, 2010
Outline • Review of the Markham method of labeling compared with CD4 T cell decline rate categorization of progressors. • Selection Process • Prediction • Statistical Approach • Results • Discussion/ Comparison to More Recent Studies • References
Categorizing Progressors by CD4 T cell Count • Patterns of HIV-1 evolution in individuals with differing rates if CD4 T cell decline • Rapid Progressors • Fewer than 200 CD4 T cells, within 2 years of seroconversion • Moderate Progressors • CD4 T cell levels 200-650 during 4 year period • Non-progressors • CD4 T cell levels above 650
Selecting Subject Clones • Selected the most recent visits that had sequenced clones.(Many had 0 clones for last 3+ visits) • Utilized only “Distinct Sequences”
What we predict… • Subj. 6 (Moderate Test) and 13 (Non-Progressor) will be less divergent and have less diversity than when 6 is compared to another Moderate (5,7) • Subj. 7 (Moderate Test) and 10 (Rapid-Progressor) will be less divergent and have less diversity than when 7 is compared to another Moderate (5,6) • Subj. 6 and 7 will be more divergent and have higher diversity in comparison to values generated in the above.
Statistical Approach • Utilized BedRock • Conduct Clustdist multiple sequence alignment for comparison and frequency values used to : • Calculate • ''S'' • ''Theta” to measure Divergence • ''Minimum'' and ''Maximum” • S/Number of clones to interpret Diversity
Divergence • Min. and Max. values show that 6 and 10 are most divergent • Considers Frequencies
Diversity shows a clearer picture • Diversity similarities between (6,5) & (13,5)
Revisiting the Results • Divergence does not prove to be an accurate method of categorizing • Theta did not deliver insight • Diversity levels are similar in certain categories
Implications of using CD4 Tcell Decline Rate to Categorize • This method is • Better than Markham’s method of categorization • Especially in categorizing moderates from rapids • Not as successful • without a larger sample size • Not much success in comparing all • In the future • Find a way to calculate the significance • A larger sample size • Use a program that would allow a comparison with higher number of clones • Few clones available from subjects may complicate the reliability. • Focus on most recent visits and acquire clones for these visits
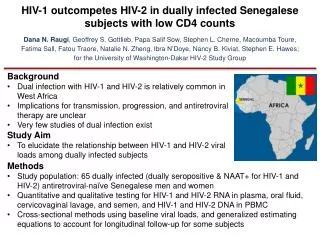
More Recent Study • Nucleotide and amino acid mutations in humanimmunodeficiency virus corresponding to CD4+ decline M. D. Hill and W. Hern´andez Ponce School of Medicine, Ponce, Puerto Rico • Published online January 3, 2006 _c Springer-Verlag 2006
Comparing our findings to more recent studies • Change in diversity of nucleotide sequences among HIV forms within individuals as their CD4+ counts progressed • There is a trend for the average distance to increase with dropping CD4+ values • Among all progressors, 94.1% of subjects demonstrated increased diversity • The rapid progressors had a statistically significant higher loop charge • Four of the rapid progressors had T-tropism
How Does this Compare?… • Found that progression is easier to evaluate than non-progression in terms of diversity • The moderate and rapid progressor were most divergent • Therefore there is an accumulation of differences over a period of time • Perhaps there needs to be further investigation in: • RNA and DNA sequences • A closer look at regions described in paper such as loop charge
References • Markham RB, Wang WC, Weisstein AE, Wang Z, Munoz A, Templeton A, Margolick J, Vlahov D, Quinn T, Farzadegan H, and Yu XF. Patterns of HIV-1 evolution in individuals with differing rates of CD4 T cell decline. Proc Natl Acad Sci U S A 1998 Oct 13; 95(21) 12568-73. pmid:9770526. • Hill MD and Hern�ndez W. Nucleotide and amino acid mutations in human immunodeficiency virus corresponding to CD4+ decline. Arch Virol 2006 Jun; 151(6) 1149-58. doi:10.1007/s00705-005-0693-8 pmid:16385396. PubMed HubMed PubGet [Paper1] • HIV project handout for statistical analysis info