Download
1 / 7
70 likes | 225 Vues
*Definitions of QualityUser-Based: What consumer says it isWhy people buy a certain vehicleManufacturing-Based: Degree to which a product conforms to design specificationtolerances, engineeringProduct-Based: Level of measurable product characteristicMPG, HP, 0-60 speed, 60-0 speedReliability

E N D
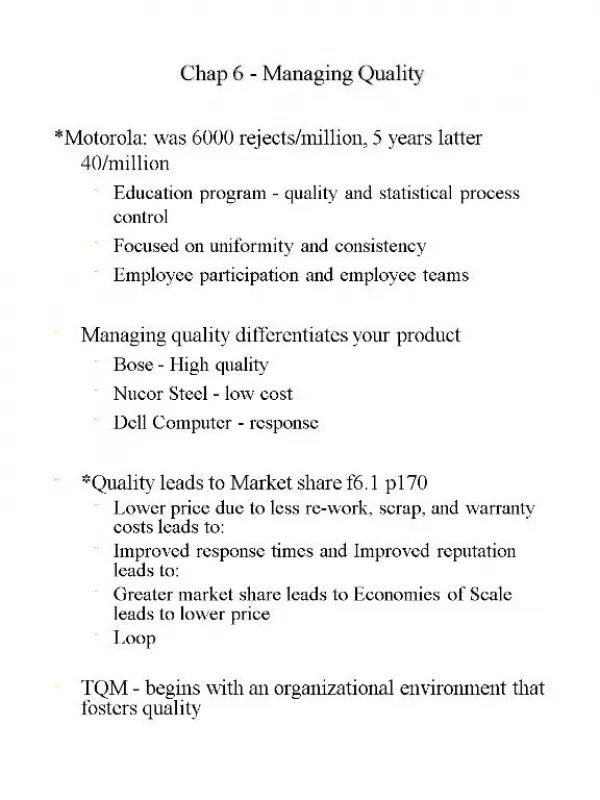
1. Chap 6 - Managing Quality
*Motorola: was 6000 rejects/million, 5 years latter 40/million
Education program - quality and statistical process control
Focused on uniformity and consistency
Employee participation and employee teams
Managing quality differentiates your product
Bose - High quality
Nucor Steel - low cost
Dell Computer - response
*Quality leads to Market share f6.1 p170
Lower price due to less re-work, scrap, and warranty costs leads to:
Improved response times and Improved reputation leads to:
Greater market share leads to Economies of Scale leads to lower price
Loop
TQM - begins with an organizational environment that fosters quality
2. *Definitions of Quality
User-Based: What consumer says it is
Why people buy a certain vehicle
Manufacturing-Based: Degree to which a product conforms to design specification
tolerances, engineering
Product-Based: Level of measurable product characteristic
MPG, HP, 0-60 speed, 60-0 speed
Reliability & durability, Conformance, Serviceability, Appearance, Perceived quality
Reasons Quality is Important - Company reputation, Product liability, Global implications (Yugo)
International Quality Standards
Z8101-1981 (Japan)
*ISO 9000 series (Europe/EC) for products sold in Europe
ISO 14000 series (Europe/EC) recycling & labeling
Life-cycle assessment - ie computers
ASQC Q90 series; MILSTD (U.S.)
Malcom Baldridge National Quality Award (U.S.)
3. TQM
Encompasses entire organization, from supplier to customer
W. Edwards Deming, 14 points, t6.1 p175, post WWII Japan Died in 1993
**5 Concepts of TQM
1. Continuous improvement
people, equipment, suppliers, material, procedures
Other names - Kaizen (Japanese), Zero-defects, Six sigma
eliminate variables that effect quality
2. Employee empowerment
Getting employees involved in product & process improvements - communication
85% of quality problems are due to process & material - find a better way to build it
Solve problems at the lowest level - Let workers make decisions
Build teams & quality circles (Saturn ads)
4. 3. Benchmarking
target to compare your performance
similar organizations, but not necessarily the same industry
�best practices� of other firms
LL Bean p177, Warehouse - common sense
4. Just-in-time (JIT)
produce or deliver goods JIT
�vendor partnership programs�
Reduces all inventory levels - costs
Immediately exposes bad quality, eliminate variables
Good quality supply - no need for large inventory
Holding cost verse volume discount
5. Taguchi Techniques
*Most quality problems result from product & process design
Produce products uniformly regardless of manufacturing conditions
6. Knowledge of tools
Every one must be trained in the techniques of TQM
Everyone must see the big picture and have an organizational focus
5. 7 Tools for TQM, f6.5 p180
a) Check Sheets, tallies, cross-tabs
b) Scatter Diagrams, x-y plot
c) Cause and Effect Diagram (Fish-Bone) f6.6 p181
Used to find problem sources/solutions
Main causes for problem as �bones�
Problem sub-areas on each bone.
d) Pareto Chart p182
a method of organizing errors, problems or defects
Joseph M Juran, post WWII Japan, �80% of a firm�s problems are a result of only 20% of the causes�*
e) Flow Charts - graphically represent a process or system
f) Histograms - graphical representation of a frequency distribution. Used of goodness of fit analysis, determine how the data is distributed.
6. g) Statistical Process Control Chart
quality measurement on the y axis, time on x axis.
Determine if the process is in control. Is the machine working properly.
Uses statistics & control charts to tell when to adjust process f 6.7 p184
Create standards, upper & lower limits, UCL, LCL, target value
Take corrective action (if necessary)
The Role of Inspection
*Inspection - measuring tasting, touching, weighing, testing
Examining items to see if an item is good or defective
Inspection may destroy product
Detecting a defective product does not correct deficiencies in process or product
*Quality can not be inspected into a product
Source Inspection - doing the job properly, employee empowerment
Poka-yoke - �foolproof� - avoid errors & provide quick feedback, Fries example p185
7. TQM In Services
Service quality is more difficult to measure than for goods
Service quality perceptions depend on expectations vs. reality
When people brag about restaurants or movies
Focus group research, what is quality service
10 determinants in t6.4 p187
When technology has evened out, product distinction can be found in service, copiers, computers.
Liability Issues
Expectations for quality levels are higher than ever.
Tolerance are tighter
pill bottles, p188
food poisoning
recall done immediately.