Download

1 / 36
360 likes | 681 Vues
Heavy precipitation in Southeastern Norway during Summer 2007. How well was it predicted?. Prec. Summer 2007. The situation was quite unusual Much wetter than the summer 2006 Normally 12-15 days with precipitation each month – June till August This summer : Up to 25 days each month

E N D
Heavy precipitation in Southeastern Norway during Summer 2007 How well was it predicted?
Prec. Summer 2007 • The situation was quite unusual • Much wetter than the summer 2006 • Normally 12-15 days with precipitation each month – June till August • This summer: Up to 25 days each month • Types of prec.: Heavy showers and frontal
Prec. Summer 2007 • Several places got more than 300 % of the normal • Several records were beaten • Highest daily prec.: June 90,3 mm July 76,5 mm • Max. monthly prec.: Around 300 mm
Oslo 24.6 Several situations like this one
June 24. 2007 • 1445 – 1600 hrs: 56,1 mm (84 min) • 49,3 mm (60 min) • 38,6 mm (30 min)
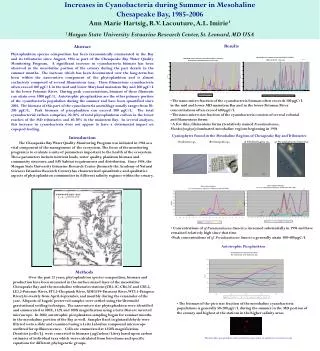
Radar and UM1 24.6 12 utc 15 utc
Conclusion 1: All models had too much precipitation Highest deviation: Hirlam20/10 followed by UM4 and EC In spite of this: Hirlam underestimated the strongest prec. events.
Conclusion 2: • Showery prec.: - The models give prec. but - Seldom at wright place and time - Too low values compared with obs. - Too bad in the most intense and local incidents • Frontal prec.: - You never know – either too much or too little prec. • Local prec.: Described best in models with the lowest resolution
We are dependent of the models, but do we know when we can trust in them and when we should be more skeptical. • The answer is both yes and no – depending of situation and person (knowledge). • But in several cases we won’t be able to tell the “truth”.
We can NOT trust completely in the models. The human knowledge and criticism is for the time being very important – but for how long?
Models • EC: Resolution appr. 25x25 km², or 0,25° lat. and long. • Hirlam20: Resolution appr. 20x20 km², or 0,2°. • Hirlam10: Resolution appr. 10x10 km², or 0,1°. • UM4 - Unified Modell (MetOffice). Resolution of 4x4 km². • UM1: Resolution 1x1 km².