Download
1 / 30
300 likes | 465 Vues
Eco NW Sustainable Construction Workshop 6 th September 2005 Andrew Thomas Centre for Construction Innovation NWDA Construction Best Practice hub. CCI Support………. Sector Skills Productivity Alliance Construction SSPA RENEW Regeneration arm of NWDA HMRF Pathfinders

E N D
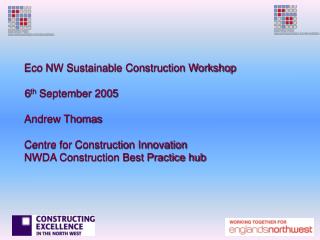
Eco NW Sustainable Construction Workshop6th September 2005Andrew ThomasCentre for Construction InnovationNWDA Construction Best Practice hub
CCI Support……….. Sector Skills Productivity Alliance Construction SSPA RENEW Regeneration arm of NWDA HMRF Pathfinders NWDA & NWDA Grant Recipients Manchester Construction Initiative Merseyside Construction Partnership Local Authorities Many Contractors, Designers, Suppliers Best Practice hub for Clubs & NW Construction Cluster Regional Centre of Procurement Excellence Broadband and Visualisation Projects Demonstration Projects Innovation Forum ……..and others ALL Professional Institutions
Some of the Reports……..10 years of Sector related History • Constructing the Team Latham 1994 • Rethinking Construction Egan 1998 • Achieving Excellence Treasury 1999 • Building a Better Quality of Life DETR 2000 • Better Public Buildings CABE/PM 2000 • Modernising Construction NAO 2001 • Accelerating Change Strategic Forum 2002 • National Procurement Strategy ODPM 2003 • Egan Skills Sustainable Communities ODPM 2004 • Gershon Efficiency review Treasury 2004
What is NOT Sustainable ……Construction ? Using over 420 million tonnes of material resources, and converts 6,500 hectares of land from rural to urban use each year. 13 million tonnes of construction and demolition waste is material delivered to sites but never used. Generating 90 million tonnes of construction and demolition waste every year, That is 3 times the waste produced by all UK households combined. Consuming 10% of national energy in the production and transport of construction products and materials Building services accounts for 50% of the UK’s emissions of carbon dioxide. Creating 21% of the hazardous waste in the UK.
Bad Action = Bad Consequences Climate change is making flood management an increasingly important factor in deciding where to locate new development. Presently, 1.85 million houses 185,000 commercial properties are at risk from flooding figures that are likely to increase under planned future development……. without considering climate change.
Construction Industry : Conclusions • Service Business often component Assembly • Demand Oriented • Legislatively driven • Historic “one off” Project mentality • Reactive rather than Proactive • “Mr Fix it” Problem Solving approach Often treats the symptom and not cause……
The NW regional AQ picture Huge regional variances in AQ performance Urban Hot spots………. Rural fall out = areas of consequences Agency Policy and Govt Policy driving towards Sustainability in Design and Action. Sub regional URC’s ( Blackpool Salford others) an important vehicle to deliver Policy Agency require measured performance on own projects and funded projects….. Seeking ongoing sustainable improvements …… and to reduce negative impacts
NWDA Tools of Change • Education – Brochures, leaflets, awareness raising, Sustainability NW, Event involvement, EnWorks provision, Sustainability NW and others • Motivation – Awards sponsorship, recognition of Best Practice, Acknowledgement of Excellence, Competitive advantage under Quality selection and performance based work awards. • Lead by Example – be seen to do, as you expect others to do for and with you • Expectation – It is how we do business, if you don’t do, then you won’t get • Conditionality of behaviour – If you say you do, and then don’t….there will be consequences and clawback • Measurement …….and consequence – how you measure will be prescribed and in a standard form. • Review of strategy and actions to accommodate change – RES review taking place during 2005 – please involve yourself and inform the future
Mystified by frameworks ? Framework Toolkit www.ivisual.co.uk/ce Benefits Economies of Scale Buying Leverage Standard solutions Continuity Integration Collaboration of Supply Chain Efficiency gains
OGC Minimum Standards in Contract • OGC are establishing basic requirements for all construction projects • Currently in review stage for Summer 2005 publication – current list • Basic environmental standards • Considerate Constructors • CSCS cards for all site personnel • And others NWDA establishing design and sustainability review panels, Green Design Guides, Enhanced Project Appraisal processes – all reflecting sustainability issues, Conditional minimum standards, use of KPI’s – and on grant funded projects. Explicit Sustainability measure and targets piloted in project funding contracts - Project unity – to be rolled out on ALL future projects
On Line KPI Engine Standardising measurement and easier data collection Measured performance – use of Environmental Indicators
Improving Public Services Through Better Construction & Development • Looking for 2.5% improvement in efficiency 2005/ 6 • Key Recommendations • Better long term planning (5 year horizons) • Leadership and cross departmental activity • Transparent procurement and influencing supplier behaviours • Use of Gateways • Sustainability Action Planning • Use of WLC/ WLV data • E Govt and E procurement Benefits cashable and non cashable Adoption of sustainability Checklist – learning from SEEDA Gershon / Efficiency review, plan and targets
Environment Improving Public Services Through Better Construction • Use of benchmarking and performance to keep competitive tension in long term arrangements • Collaborative contracts (ECC mentioned) and fair pay arrangements • Post-completion performance • Energy efficiency • Combine construction activity across depts • Support for infrequent clients • Identify and support good practice Minimum BREEAM Very Good on all NWDA projects, sustainability checklist, Quality Based selection on frameworks, Regional Transport Strategy, Obligations on Developers to include Public transport alternatives.
Transport is a HUGE Polluting Influence New Build school in Cheshire Environmental Performance Indicators – Transport Aim - Calculate Number of Miles on the Construct Project How ??
Environmental Performance Indicators – Transport • Site Management / Staff • Permanent Staff • Visiting Staff & general visitors • Engineer etc • Subcontractors / Directly Employed Craftsmen • Groundworkers & M&E operatives • Single visit contractors – white lining, mastic, diamond drilling etc • Labourers • Material & Plant Deliveries • Willmott Dixons material & plant deliveries & collections • Subcontractors deliveries & collections • Clients deliveries
SUMMARY OFCALCULATION Total Mileage - 221,758 miles Cost of Project - £1.32 million Gross Floor Area - 1,105 m2 Cost / m2 - £1,195 / m2 Mileage (50p/mile) - 221,758 x 50p = £111,000 or 8.5% of project cost Interesting Statistic ? ….. for a small school in Cheshire Lets put it into perspective…………
Emissions from Light and Heavy Vehicles Emissions in 2005 for a motorway with a fleet mix of 90:10 (LDV:HDV). Speeds set at 112kph for LDV and 100kph for HDV. Emissions in g.veh/km.
Emissions – Percentage HDV • HDV generally make up 10-12% of the vehicle fleet. • HDV contribute larger amounts to emissions of vehicles • 1 lorry is equivalent to about 10 cars in terms of NOX and PM10 emissions.
Do we know the scale of the challenge ? • London • “Ensure developments are of high quality, incorporating sustainable design and construction methods to minimise the environmental impact.” - (Draft London Plan, GLA, June 2002) • Based on Corporation of London and BRE figures • over 4,000 construction vehicles entering the City of London daily trips • If each vehicle trip is 22.5 kms this means over 24,000 tonnes of CO2 into the atmosphere yearly, enough to fill 4,000 hot air balloons • Congestion charging • £5 per vehicle per day • Nationally • 360million tonnes of construction materials are used each year • The equivalent of 90 million full truck loads of 4 tonnes • Industry is worth £60 billion annually (8% of GDP) Do we even know what Regional and sub regional Numbers are ?
Traditional Methods of Delivery to Construction Projects Site 1 Congestion - pollution Waste Unproductive Health & safety risks Site 2 Site 3 Site 4 Learning from others ?
Site 1 CC Site 2 “JIT milkround” Site 3 Site 4 Direct Deliveries Learning from Others…..
Learning from Others ?Additional impacts / Benefits • Economic Impact • Increases in project plan reliability of up to 5 % • Net cost savings from trade contractor packages of 1.9% • Environmental Impact • Local delivery vehicle CO2 emissions reduced by 11.6 tonnes, a 37% reduction. • Local delivery vehicle distance travelled reduced by 23,200 kms. • Delivery routes controlled and kept away from problem congestion areas • Noise impact of delivery vehicles reduced • Re-use of existing assets, such as pallets and hoardings • Social Impact • Reduced storage on site thus reducing the risk of accidents • Improved security • Local employment
Construction Industry : Conclusions • Service Business often component Assembly • Demand Oriented • Legislatively driven • Historic “one off” Project mentality • Reactive rather than Proactive • “Mr Fix it” Problem Solving approach Often treats the symptom and not cause…… Future in Design & Integration and CSR in construction New tools and legislation needed ? ….probably
Problem ? Blackpool will be a Vibrant, Inclusive, Healthy, Safe and Prosperous Town ?
Blackpool will be a Vibrant, Inclusive, Healthy, Safe and Prosperous Town