Advancing Requirements-Based Testing Models to Reduce Software Defects
This study explores the effectiveness of requirements-based testing (RBT) in reducing software defects, particularly for safety-critical systems. By analyzing historical data from over 700 reviews, it identifies patterns of defects per requirement and emphasizes the importance of review size and reviewer experience. The proposed model aims to improve defect detection rates, minimize defect escapes, and reduce costs associated with poor quality. Key stakeholders, including customers and engineers, benefit from an enhanced review process that incorporates actionable insights and statistical modeling.

Advancing Requirements-Based Testing Models to Reduce Software Defects
E N D
Presentation Transcript
Advancing Requirements-Based Testing Models to Reduce Software Defects Craig Hale, Process Improvement Manager and Presenter Mara Brunner, B&M Lead Mike Rowe, Principal Engineer Esterline Control Systems - AVISTA
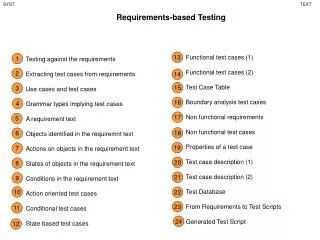
Software Requirements-Based Testing Defect Model • Focus: requirements-based test (RBT) reviews • Quality imperative, but cost impacts • Large amount of historical data • Model: defects per review based on number of requirements • Suspected review size a factor • Used for every review • Looked at controllable factors to improve reviews effectiveness • Stakeholders: • Customers • Project leads and engineers • Baselines and models team
Model Goals • Improve overall quality of safety-critical systems • Focus on improving review process • Maximize defect detection rate • Minimize defect escapes • Reduce defect injection rate • Reduce cost of poor quality • Defect process performance baselines split • Application type – avionics, medical, etc. • Embedded vs. non • Complexity level
Factors • 2011 Metrics • 738 reviews over three years • 19,201 requirements • Customers: 10, projects: 21, jobs: 36 • 2012 Metrics • 337 reviews over one year • 2,940 requirements • Customers: 5, projects: 7, jobs: 11 • Y Variables • Number of defects per review (D/R) - discrete: ratio data type • Defects per requirement (D/Rq) - continuous: ratio data type
Predicted Outcomes • Expected defects in the review per number of requirements • Important to understand if exceeding expected defects • Valuable to understand if all defects were detected • Inverse relationship of defects/requirement detected and review size
Modeling Techniques • Non-linear regression vs. linear regression vs. power function • Standard of error estimate varied considerably • Partitioned into nine intervals • Monte Carlo simulation • Standard of error estimate did not change by more than 0.000001 for ten iterations • Determined standard of error estimate for each partition
Factors and Correlation Tables D = Defects PT = Preparation Time R = Review Rq= Requirement
Output from Model 2011 4 Requirements 20 Requirements
Pilot Results 2011 • Determined to automate model • Needed statistical formula for variance • More guidance on what to do when out of range
Results, Benefits and Challenges • Points to decreasing variation in defects • Provides early indicator to fix processes and reduce defect injection rate • Indicates benefits for small reviews and grouping • Challenged with gaining buy-in, training and keeping it simple
Potential New Model Element – Years of Experience • Purpose: Investigate the relationship between a reviewer’s years of experience and the quality of reviews that they perform • Expected Results: Engineers with more experience would be better reviewers • Factors: Data studied from 1-Jun-2011 through 25-May-2012 • 337 internal reviews • 11 jobs • 7 projects • 5 different customers
Potential New Model Element – Years of Experience • Findings: • Analyzed trend between the independent variable and total years of experience • The review process showed stability with no significant impact per years of experience
Summary • What worked well • Utilizing historical data to predict outcomes • Encouragement of smaller data item reviews • Improving the defect detection rate of data item reviews • Future plans: Continue to enhance the model • Requirement complexity • Expand lifecycles • Expand activities • Safety criticality