Determining Vitamin C and Calcium Concentrations
260 likes | 484 Vues
Determining Vitamin C and Calcium Concentrations . By: Nicole Dixon Richard Kiehnau Amanda Lagace Courtney Belanger. Purpose.

Determining Vitamin C and Calcium Concentrations
E N D
Presentation Transcript
Determining Vitamin C and Calcium Concentrations By: Nicole Dixon Richard Kiehnau Amanda Lagace Courtney Belanger
Purpose • In this experiment, we will endeavor to confirm the vitamin C and calcium percentages in various enhancement drinks including VitaCoco, orange juice, Vitamin Water, and LifeWater to determine which is best overall in terms of vitamin C and calcium content. The experiment will be conducted in two parts, using titrations with iodine and titrations of EDTA.
Method • Starch Solution: Make a paste of soluble starch (1 g) in water (10 mL) and pour into boiling water (100 mL). Boil until clear. • Iodine Solution: Dissolve KI (10.00 g) and KIO3 (0.607 g) in distilled water (400 mL). Add 3M H2SO4 (60 mL). Pour into a 1000 mL volumetric flask and dilute to mark with distilled water.
Method (continued) • Determination of Ascorbic Acid: Dissolve ascorbic acid (0.25 g) in water (100 mL) and dilute to 250 mL. Add 20 mL of ascorbic acid solution and 2 mL of starch to a 125 mL Erlenmeyer flask. Titrate with iodine solution until an endpoint is reached. (Dark blue colour) Repeat for three good trials. • Determination of drinks: Add 40 mL of the drink and 2 mL of starch to a 125 mL Erlenmeyer flask. Tirate until an endpoint is reached. (Dark blue colour) Repeat for three good trials. Repeat for all drinks.
Conclusion • Our results show, through analysis of percent error, the best match to the advertised vitamin C content was VitaCoco with 2.6% error. • With our experimental results, Vitamin Water comes off as the frontrunner with 177.6 mg of Vitamin C, followed closely by orange juice (153.7 mg), then VitaCoco (107.8 mg), and finally, LifeWater (8.7 mg). • Therefore, according to the experimental results, in order to get the largest amount of vitamin C, one should drink Vitamin Water (the Rise variety).
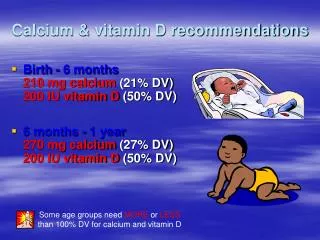
Background • Calcium is essential for living organisms because it helps mineralize bones in humans. • Acid-base titrations depend on the neutralization between an acid and a base when mixed in solution. In addition to the sample, an appropriate indicator is added to the titration chamber, reflecting the pH range of the equivalence point.
Method For Calcium Content • A pH meter was used to calibrate ammonia buffer to a pH of 10. • A standard 0.1 M EDTA solution was made by dissolving 1.4072g EDTA in 8 mL buffer. This was diluted with water. • A calcium carbonate solution was made by reacting CaCl2 in HCl. • Four sets of titrations were performed. • The lifewater, coconut water and vitamin water were made by pipetting 25 mL of the chosen beverage with 3 mL of buffer. • 10 mL of the orange juice, 15 mL of water and 3 mL of buffer were added to a flask and titrated. The best 3 results out of the titrations were taken.
Data CaCO3 Vitamin Water:
Data Lifewater Coconut Water
Data Orange Juice
Results: All the calculated results were of the amount of calcium in one bottle based on the percent of recommended daily value
Results: • After observing our calculations, we determined that the most beneficial drink as far as calcium content was vitamin water. However, the drink that had the closest experimental value to the actual amount was coconut water. Overall, the lab was successful but the percent errors we received were high for most of the beverages. In the future, amounts of the beverage can be changed to better the experiment. One issue that arose was that a color change was often hard to see when titrating due to the various colors and opacity of the beverages.