Download
1 / 22
220 likes | 381 Vues
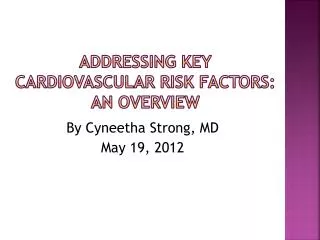
Association of Change in Cardiovascular Risk Factors With Incident Cardiovascular Events. Presenter: WEN- Ching Lan Date: 2019/02/27. Thomas T. van Sloten , MD, PhD; Muriel Tafflet , MSc; Marie-Cecile Perier , MSc; Aline Dugravot , PhD ;

E N D
Association of Change in Cardiovascular Risk Factors With Incident Cardiovascular Events Presenter: WEN-ChingLan Date: 2019/02/27 Thomas T. van Sloten, MD, PhD; Muriel Tafflet, MSc; Marie-Cecile Perier, MSc; Aline Dugravot, PhD; Rachel E. D. Climie, PhD; ArchanaSingh-Manoux, PhD; Jean-Philippe Empana, MD, PhD JAMA of 2018
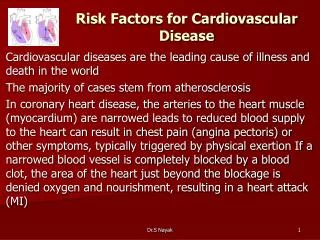
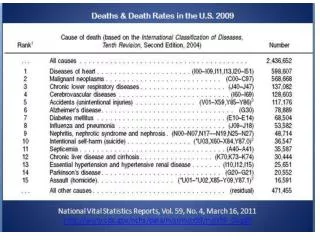
Introduction • The AmericanHeartAssociation (AHA) developed a simple 7-item tool consistingof 4 behavioral metrics and 3 biological metricsfor promoting ideal cardiovascularhealth. • Single assessmentof cardiovascular health 1
AIM • To quantify the association of time-varying cardiovascular health during follow-up with incident CVD events, all-cause mortality, and cause-specific mortality; • To describe change in cardiovascular health over 10 years; • To quantify the association of change in cardiovascular health with subsequent incident CVD and mortality. 2
Methods • Participants • The Whitehall II study is an ongoing prospective cohort study originally employed by the British civil service in Londonbased offices. • A total of 10 308 participants were recruited between 1985 and 1988. • self-administrated questionnaires were completed approximately every 5 years 3
Methods • Cardiovascular Health Metrics and Status • The AHA criteria were used to define the 7 metrics of cardiovascularhealth at allwaves. • Change in cardiovascular health was examined between 1985/1988 and 1997/1999 in participants having the 7 metrics at both time points. • All participants were required to be free of CVD event between 1985/1988 and 1997/1999 examinations. 4
Methods • Covariates • Sociodemographic variables included age, sex, race/ethnicity,marital status,socioeconomic status,education, • Depressive symptomswere • Family history(myocardial infarction or stroke) 5
Methods • Outcomes • The primary outcome was incident CVD (coronary heart diseaseand stroke combined. • The secondary outcome wasmortality. • CVD follow-up was until March 31, 2017, and mortalityfollow-up was until August 31, 2017. 7
Methods • CVD Electrocardiogram recording, self-reported coronary heart disease, Hospital Episodes Statistics database [ICD-9codes]410-414, [ICD-10codes] I20-I25, or [ICD-10procedures]K40-K49, K50, K75, U19 • Stroke Augsburg stroke questionnaires [ICD-9 codes] 430, 431, 434, 436 and [ICD-10 codes] I60-I64 • Mortality linkage to the British National MortalityRegister 8
Methods • StatisticalAnalysis • Time-VaryingAnalysis • Competingrisk analysis • Kaplan-Meier curves • post hoc analyses 9
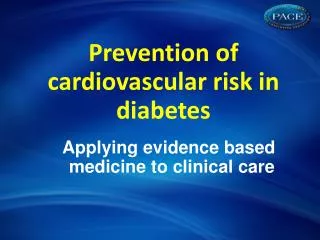
Methods • Sensitivity Analyses • The Framingham Offspring Study • using the 14-point cardiovascular health score (Consistentlyhigh (≥8 to ≥8), high to low (≥8 to ≤7), low to high (≤7 to ≥8),consistently low(≤7 to ≤7).) • Cox regression • missing cardiovascular health metrics and covariates were imputed by multiple imputation. 10 http://www.hksports.net/hkpe/sports_medicine/framingham_heart_study.htm
Results 11
Results 12
Results 13
Results Values indicate the percentage of participants in that cardiovascular health category, and colors indicate rate per 1000 person-years. Median follow-up after1997/1999 was 18.9 (interquartile range [IQR], 17.8-19.3) years for cardiovascular disease (CVD) and 19.7 (IQR, 18.9-19.8) years for mortality. Heatmaps of unadjustedincidence rates of CVD and all-cause mortality for change in the number of ideal health metrics are in eFigure 6. 14
Results 15
The follow-up of cardiovasculardisease (CVD) and mortality startedafter 1997/1999, ie, 10 years after thebaseline cardiovascular healthexamination. All individuals with aCVD event within 10 years after thebaseline cardiovascular healthexamination were excluded from thisanalysis. The median duration offollow-up was 18.9 (interquartilerange [IQR],17.8 to 19.3) years for CVDand 19.7 (IQR, 18.9 to 19.8) years formortality. The low to high group(n = 19) is not reported as only 1 CVDevent and 2 deaths occurred duringfollow-up. Curves are ordered fromhighest to lowest risk for incidentCVD and all-cause mortality. 16
Results 17
Results 18
Limitations • The observational design precludes reaching causal conclusions about the findings. • Individuals excluded from the analysis of change in cardiovascular health hadaless favorable cardiovascular risk profile • Some categories of cardiovascular health change were small in size. • aging, temporal trends, and cohort attrition • healthy worker effect 19
Conclusions • There was no consistent relationship between direction of change in category of a composite metric of cardiovascular health and risk of CVD. 20