Download
1 / 7
70 likes | 215 Vues
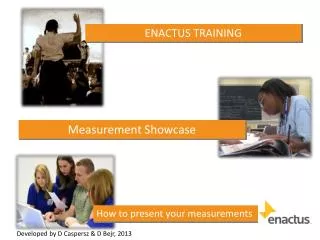
ENACTUS TRAINING. Measurement Showcase. How to present your measurements. Developed by D C aspersz & D Bejr , 2013. Showcasing your measurements. At the National Conference, you will showcase your projects and their outcomes, including quality of life and standard of living.

E N D
ENACTUS TRAINING Measurement Showcase How to present your measurements Developed by D Caspersz & D Bejr, 2013
Showcasing your measurements At the National Conference, you will showcase your projects and their outcomes, including quality of life and standard of living. But how do you show the difference your project made? How do you convert numbers into something more interesting for your showcase?
Showing the Difference:Pre and post results Must show pre (before your project began) and post (after your project began) results This shows the difference or how things changed because of your project! You can: Show the numbers of before and after your project Talk about the increase or decrease, in numbers or percentages
Testimonials Testimonials can be used from participants, or participants guardians/employers/carersetc Must show the DIFFERENCE of pre and post test. For example, rather then a testimonial from one student explaining how they enjoyed your project, also have a testimonial from their teacher explaining how many students completed the course after your project compared to before.
Graphs Any type of graph that can show a difference; line, pie, bar, the possibilities are limitless
Infographics Use pictures to show your information Must be relevant and easy to understand
Showcasing Measurements Examples Egypt 2012: 4:19 http://www.youtube.com/watch?v=ynP8D8sIf7U USA 2012: 5:00 http://www.youtube.com/watch?v=vao7Crvd2gQ Germany 2011: 16:57 http://www.youtube.com/watch?v=u9aKKoHhcPg Youtube enactus or SIFE to find more great presentation examples