Download
1 / 7
80 likes | 199 Vues
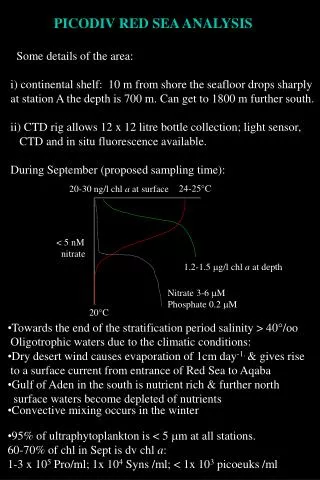
PICODIV RED SEA ANALYSIS Some details of the area: i) continental shelf: 10 m from shore the seafloor drops sharply at station A the depth is 700 m. Can get to 1800 m further south. ii) CTD rig allows 12 x 12 litre bottle collection; light sensor,

E N D
PICODIV RED SEA ANALYSIS • Some details of the area: • i) continental shelf: 10 m from shore the seafloor drops sharply • at station A the depth is 700 m. Can get to 1800 m further south. • ii) CTD rig allows 12 x 12 litre bottle collection; light sensor, • CTD and in situ fluorescence available. • During September (proposed sampling time): • Towards the end of the stratification period salinity > 40/oo • Oligotrophic waters due to the climatic conditions: • Dry desert wind causes evaporation of 1cm day-1. & gives rise • to a surface current from entrance of Red Sea to Aqaba • Gulf of Aden in the south is nutrient rich & further north • surface waters become depleted of nutrients • Convective mixing occurs in the winter • 95% of ultraphytoplankton is < 5 m at all stations. • 60-70% of chl in Sept is dv chl a: • 1-3 x 10⁵ Pro/ml; 1x 10⁴ Syns /ml; < 1x 10³ picoeuks /ml 20-30 ng/l chl a at surface 24-25°C < 5 nM nitrate 1.2-1.5 g/l chl aat depth Nitrate 3-6 M Phosphate 0.2 M 20°C
0.0E+00 2.0E+05 0.0E+00 1.0E+05 2.0E+05 1.0E+05 1.0E+05 2.0E+05 0.0E+00 0 0 0 50 50 50 100 100 100 150 150 150 8.3.99 27.4.99 11.5.99 200 200 200 0.0E+00 1.0E+05 2.0E+05 0 50 100 150 14.6.99 200 Red Sea Flow Cytometry data 1999-2000 Pros Syns Euks
0.0E+00 1.0E+05 2.0E+05 0.0E+00 1.0E+05 2.0E+05 0 0 50 50 100 100 150 150 4.10.99 7.9.99 200 200 Red Sea Flow Cytometry data 1999-2000 Cells/ml 0.0E+00 1.0E+05 2.0E+05 0.0E+00 1.0E+05 2.0E+05 0 0 50 50 Depth (m) 100 100 150 150 23.8.99 18.7.99 200 200
0.0E+00 1.0E+05 2.0E+05 0.0E+00 1.0E+05 2.0E+05 0 0 50 50 100 100 150 150 22.11.99 18.10.99 200 200 0.0E+00 1.0E+05 2.0E+05 0.0E+00 1.0E+05 2.0E+05 0 0 50 50 100 100 150 150 27.12.99 10.1.00 200 200 Red Sea Flow Cytometry data 1999-2000
Red Sea Temperature Profiles 1999-2000 Temperature °C 20 22 24 26 28 0 50 Depth (m) 100 150 200 16.2.99
Red Sea Temperature Profiles 1999-2000 Temperature °C Depth (m)
Red Sea Temperature Profiles 1999-2000 Temperature °C Depth (m)