Download
1 / 36
360 likes | 535 Vues
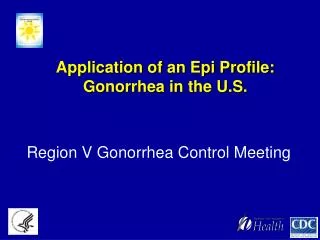
Application of an Epi Profile: Gonorrhea in the U.S. Region V Gonorrhea Control Meeting. What is an epi profile?. Standardized way to analyze & interpret data Suggested, not required Provides evidence to support public health decision-making Supplement to classroom & on-the-job training

E N D
Application of an Epi Profile: Gonorrhea in the U.S. Region V Gonorrhea Control Meeting
What is an epi profile? • Standardized way to analyze & interpret data • Suggested, not required • Provides evidence to support public health decision-making • Supplement to classroom & on-the-job training • Provides a common language for communication with other public health programs
Why do we need an STD epi profile? • High burden of disease • Insufficient funding for unlimited program activities • Few opportunities for classroom or on-the-job training experiences • Technological advances allowing for more sophisticated analysis of data
Identifying What STDs are Involved • What STDs are of importance? • Overlap in STDs : co-infections • Changes over time • Important Data Elements • Number of tests • Test results • Date of test What?
Trends in Chlamydia, Gonorrhea, and P & S Syphilis Morbidity,United States, 1999-2008* * *Preliminary data, will possibly increase
National Data Sources for Gonorrhea • Case report • Incidence • Infertility Prevention Program • Positivity • STD Surveillance Network (SSuN) • Interviews of patients with gonorrhea • STD clinic surveillance • GISP • Gonococcal susceptibility profile • APHL survey • Public health lab test type and volume • NHANES • Population prevalence (?)
Identifying Target Populations • Characterizing affected populations • Changes over time? • Important Data Elements • Age • Sex • Race/ Ethnicity • Sex of Partners • Date of test Who?
SSuN Population-based Gonorrhea Surveillance – Sex and Sexual Orientation of Gonorrhea Patients, 2006-2008 (N=2,400)* 22.1% MSM * Preliminary data.Sexual orientation unknown for 51 men
Gonorrhea rates by age and sex, 2007 48% 15-24 years 69% 15-24 years
Rate (per 100,000 population) Female gonorrhea rates for 15-19 year olds by region and race/ethnicity, 2006
Male gonorrhea rates for 20-24 year olds by region and race/ethnicity, 2006 Rate (per 100,000 population)
Gonorrhea positivity, women 15-24, family planning clinics, by race, Washington State IPP, 2007* *Data Source: Center for Health Training, Seattle WA
Identifying Areas of High Morbidity • Geospatial distributions of disease • Venues or providers seeing high burden of disease • Changes over time • Important Data Elements • Geographic location of cases • Type of provider or venue where cases found • Local districting • Current location of STD services Where?
Gonorrhea rates by state, United States and outlying territories, 2007
Gonorrhea — Positivity among 15- to 24-year-old women tested in family planning clinics by state, 2007 *States/areas not meeting minimum inclusion criteria. Note: Includes states and outlying areas that reported positivity data on at least 500 women aged 15-24 years screened during 2006. SOURCE: Regional Infertility Prevention Projects; Office of Population Affairs; Local and State STD Control Programs; Centers for Disease Control and Prevention
Gonorrhea — Rates by county, 2007 Note: The Healthy People 2010 target for gonorrhea is 19.0 cases per 100,000 population.
Identifying Contextual Factors • Risk factors impacting STDs • Socio-demographics of population served • Social determinants of health • Policies and Laws • Important Data Elements • Medical infrastructure • Reported sexual and behavioral risk factors • Partner types and partner characteristics • Population demographics Why?
Proportion of reported gonorrhea cases from STD clinics by sex, 1984-2007* % from STD clinics Males Females *Preliminary 2007 data
SSuN Population-based Gonorrhea Surveillance – Provider Type of Gonorrhea Patients by Race/Ethnicity* (excluding STD clinic patients) Hispanics n=229 Whites n=623 Blacks n=985 *Preliminary data
Reported gonorrhea rates in the United States and Utah, 1995-2006 261% increase
Reported cases of gonorrhea by provider type, Utah, 2000-2006 667% increase 67% increase
Number of positive gonorrhea tests by test type by one private reference laboratory, Utah, 2001-2006 424% increase
Reported gonorrhea and chlamydia test* volume: Infertility Prevention Program, U.S., 2001 - 2006 32% increase 76% increase *Positive and negative test results only.
Gonococcal Isolate Surveillance Project (GISP) — Percent of Neisseria gonorrhoeae isolates with resistance or intermediate resistance to ciprofloxacin, 1990–2007* Note: Resistant isolates have ciprofloxacin MICs ≥ 1 µg/ml. Isolates with intermediate resistance have ciprofloxacin MICs of 0.125 - 0.5 µg/ml. Susceptibility to ciprofloxacin was first measured in GISP in 1990. * Preliminary 2007 data
Gonococcal Isolate Surveillance Project (GISP) — Prevalence of ciprofloxacin-resistant Neisseria gonorrhoeae by GISP site, 2004-2007* *Preliminary 2007 data
SSuN Population-based Gonorrhea Surveillance – Fluoroquinolone Use by Provider Type, Colorado and Virginia, 2007 Family Planning Fluoroquinolones prescribed, % n (cases)=127 STD clinics n (cases) =1048 ERs, Urgent Care, and Hospitals Primary Care n (cases) =507 n (cases) =515 CDC recommendations changed Source: D. Dowell, preliminary data
SSuN Population-based Gonorrhea Surveillance – Reported Risks over Past 3 Months* by Gonorrhea Patients *Preliminary data. Data not available for WA
Summary: Gonorrhea from a National Perspective • Adolescents/young adults • African Americans • Heterosexual AND MSM • Increases in test volume • Persistent racial disparities • Association with high risk behaviors • Persistent high rates of gonorrhea
“Heterosexual men and women with GC tend to be younger and African American, and to have minimal risk behaviors other than more than one partner. In contrast, MSM with GC reported a greater number of sex partners, more sex with anonymous partners, more sex with partners met on the internet, and more frequent drug use. Such data suggest two markedly different GC epidemics among heterosexuals and MSM.” Rietmeijer, et al, ‘Here Comes the Ssun’; PH Reports 2009 Supp. 2.; V. 124
Acknowledgements • STD Surveillance Network (SSuN) Collaborators • Washington, Oregon, Idaho, Alaska & Utah Departments of Health • Statistics and Data Management Branch, DSTD, CDC • Darlene Davis • Rob Nelson • Epidemiology and Surveillance Branch, DSTD, CDC • Lori Newman • Deborah Dowell • Nandini Selvam • Hillard Weinstock • Eileen Yee
Contact information Melanie Taylor, MD, MPH Taylorm@azdhs.gov 602-364-4565 The findings and conclusions in this presentation have not been formally disseminated by the CDC and should not be construed to represent any agency determination or policy.